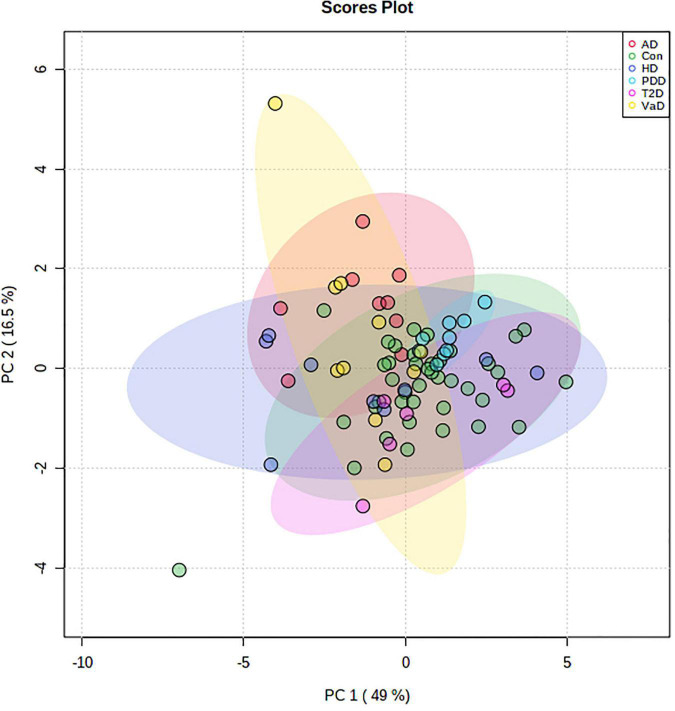
FIGURE 3.
Two-dimensional PCA plot for human dry-weight hippocampal post-mortem tissue from multiple age-related demented diseases and T2D. Data represents a PCA plot using ICP-MS-metallomic data from VaD (n = 10; yellow), AD (n = 9; red), HD (n = 9; purple), PDD (n = 9; blue), T2D (n = 6; pink), and control (n = 40; green) dry-weight hippocampal post-mortem tissue. The colored ellipses around each cohort signify 95% confidence regions. The first (Dim1) and second (Dim2) principal components contribute to 49 and 16.5% of the total variance, respectively. No visible separation is apparent between all cohorts. n = number of post-mortem human samples. AD, Alzheimer’s disease; Con, Control; ICP-MS, Inductively coupled plasma-mass spectrometry; PDD, Parkinson’s disease dementia; T2D, Type-2 diabetes; VaD, Vascular dementia.

