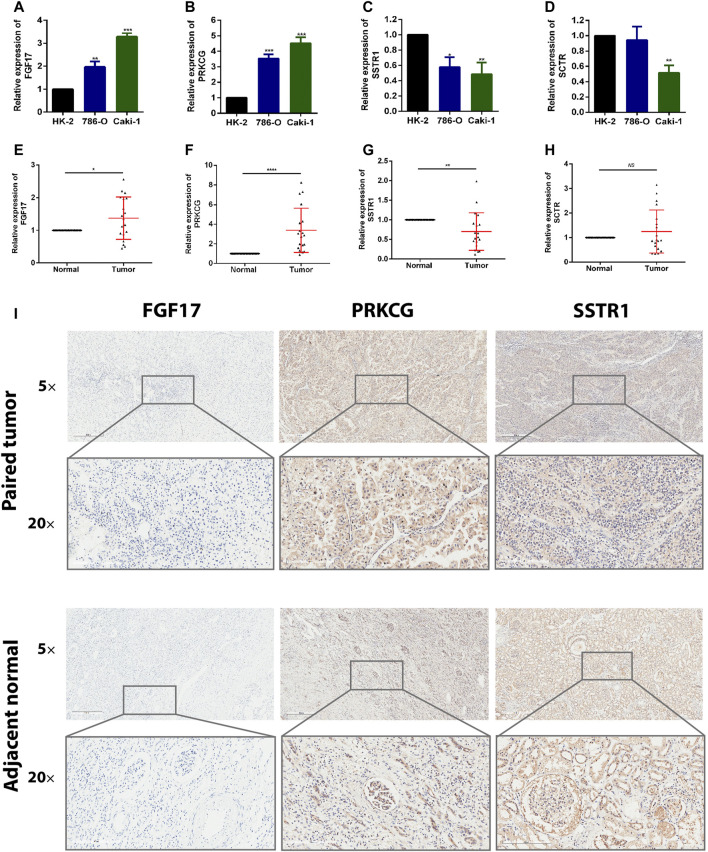
FIGURE 9.
Expression of these hub genes in human KIRC specimens, adjacent normal tissues, and cell lines. (A–D) qRT-PCR analysis of FGF17 (A), PRKCG (B), SSTR1 (C), and SCTR (D) in KIRC cell lines. GAPDH was used as a loading control. (E–H) qRT-PCR analysis of FGF17 (E), PRKCG (F), SSTR1 (G), and SCTR (H) in paired KIRC tissues (n = 19). (I) Representative images of FGF17, PRKCG, and SSTR1 protein immunochemistry in KIRC tissues compared with adjacent normal kidney tissues. Magnification: ×50, ×200; *p < 0.05, **p < 0.01, ***p < 0.001.

