Figure 1. .
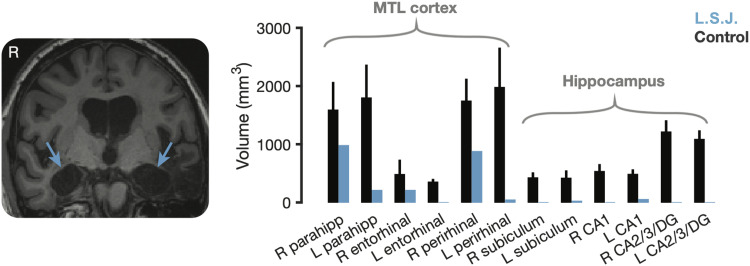
L. S. J.'s MTL anatomy. Left: Representative structural coronal slice (MP-RAGE) illustrating extensive bilateral MTL lesions in patient L. S. J. Right: MTL tissue volume in L. S. J. relative to controls, including parahippocampal cortex (parahipp), entorhinal cortex, perirhinal cortex, subiculum, CA1, and CA2/CA3/dentate gyrus (CA2/3/DG). Error bars denote ±1 SD. R = right; L = left. We note that the matched control cohort here (n = 4) is independent of the cohort tested in the main experiments. Data here are reproduced with permission from Schapiro et al. (2014).

