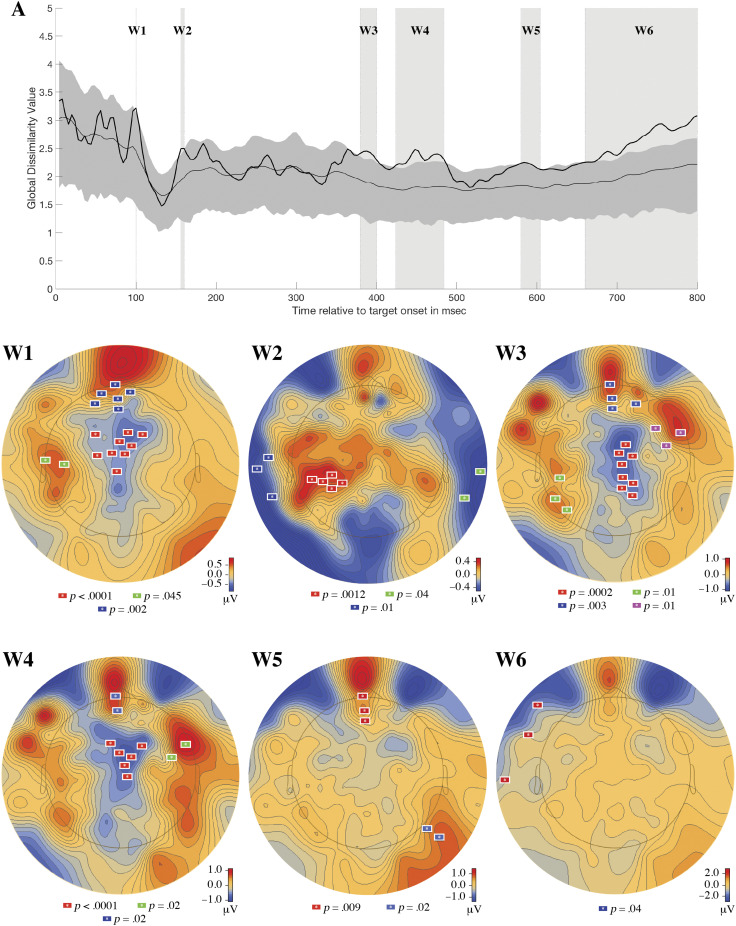
Figure 7. .
Plot A shows the time-varying generalized dissimilarity between pretest and posttest topographies for rote learning (black line). For context, the mean (light gray line) and 95% CI (medium gray area) for the generalized dissimilarity expected due to random chance (estimated from randomizing the data 5000 times) has been plotted. Six windows were identified where the observed data exceeded the upper bound of the 95% CI of the shuffled data. Plots W1, W2, W3, W4, W5, and W6 show the results of the spatiotemporal permutation-based analysis that was performed on each window. All electrode clusters shown, uniquely colored on each plot, are significant at a p < .05 level.

