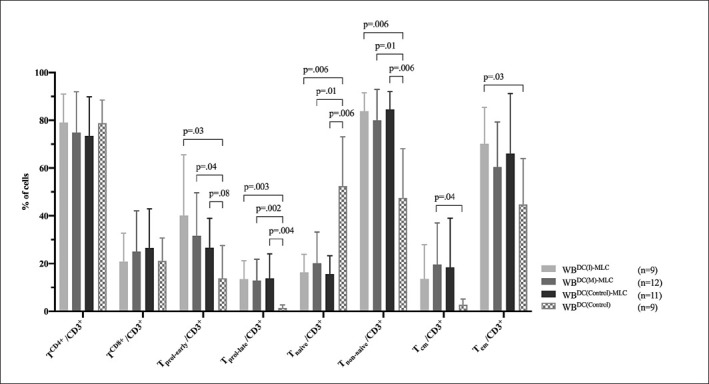
Fig. 3.

Stimulatory effect of DC/DCleu on the composition of immunoreactive cells. Given are the mean ± SD of T-cell subsets in the CD3+ cell fraction before (WBDC(Control)) and after (WBDC(I)-MLC, WBDC(M)-MLC, WBDC(Control)-MLC) DC/DCleu stimulation. Statistically significant (p values <0.05) and borderline significant (p values 0.10 to 0.05) differences are given. Abbreviations of all cell types are given in Table 2.
