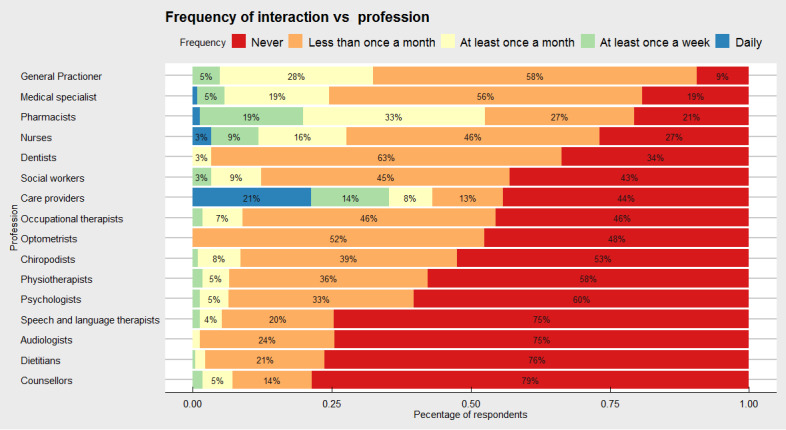
Figure 3.

Frequency of health and social care professional interactions for caregivers. The x-axis represents cumulative percentage of interactions, whereas the y-axis represents the different health and social care professional groups Frequency of use was grouped into: (1) Daily, (2) At least once a week, (3) At least once a month, (4) Less than once a month, (5) Never.
