
Figure 2.
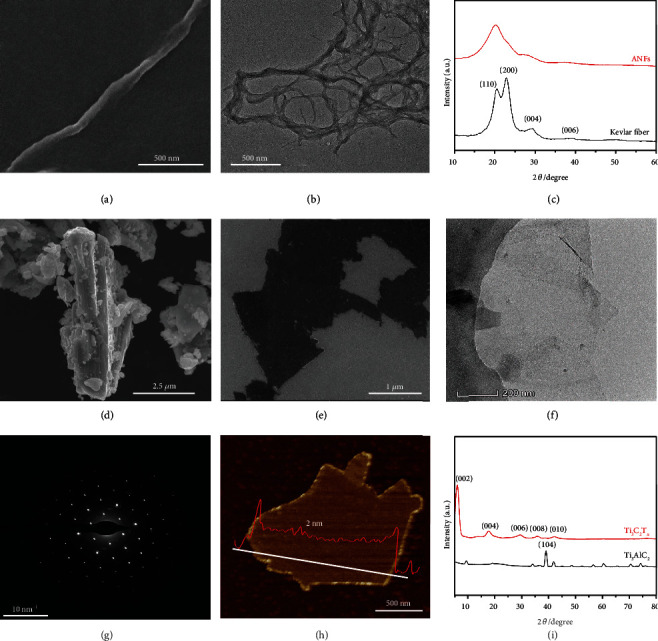
SEM (a) and TEM (b) images of ANFs; XRD spectra of Kevlar fiber and ANFs (c); SEM images of Ti3AlC2 (d) and Ti3C2Tx (e); TEM image (f) and SAED pattern (g) of Ti3C2Tx; AFM image of Ti3C2Tx (h); XRD spectra of Ti3AlC2 and Ti3C2Tx (i).
Official websites use .gov
A
.gov website belongs to an official
government organization in the United States.
Secure .gov websites use HTTPS
A lock (
) or https:// means you've safely
connected to the .gov website. Share sensitive
information only on official, secure websites.
SEM (a) and TEM (b) images of ANFs; XRD spectra of Kevlar fiber and ANFs (c); SEM images of Ti3AlC2 (d) and Ti3C2Tx (e); TEM image (f) and SAED pattern (g) of Ti3C2Tx; AFM image of Ti3C2Tx (h); XRD spectra of Ti3AlC2 and Ti3C2Tx (i).