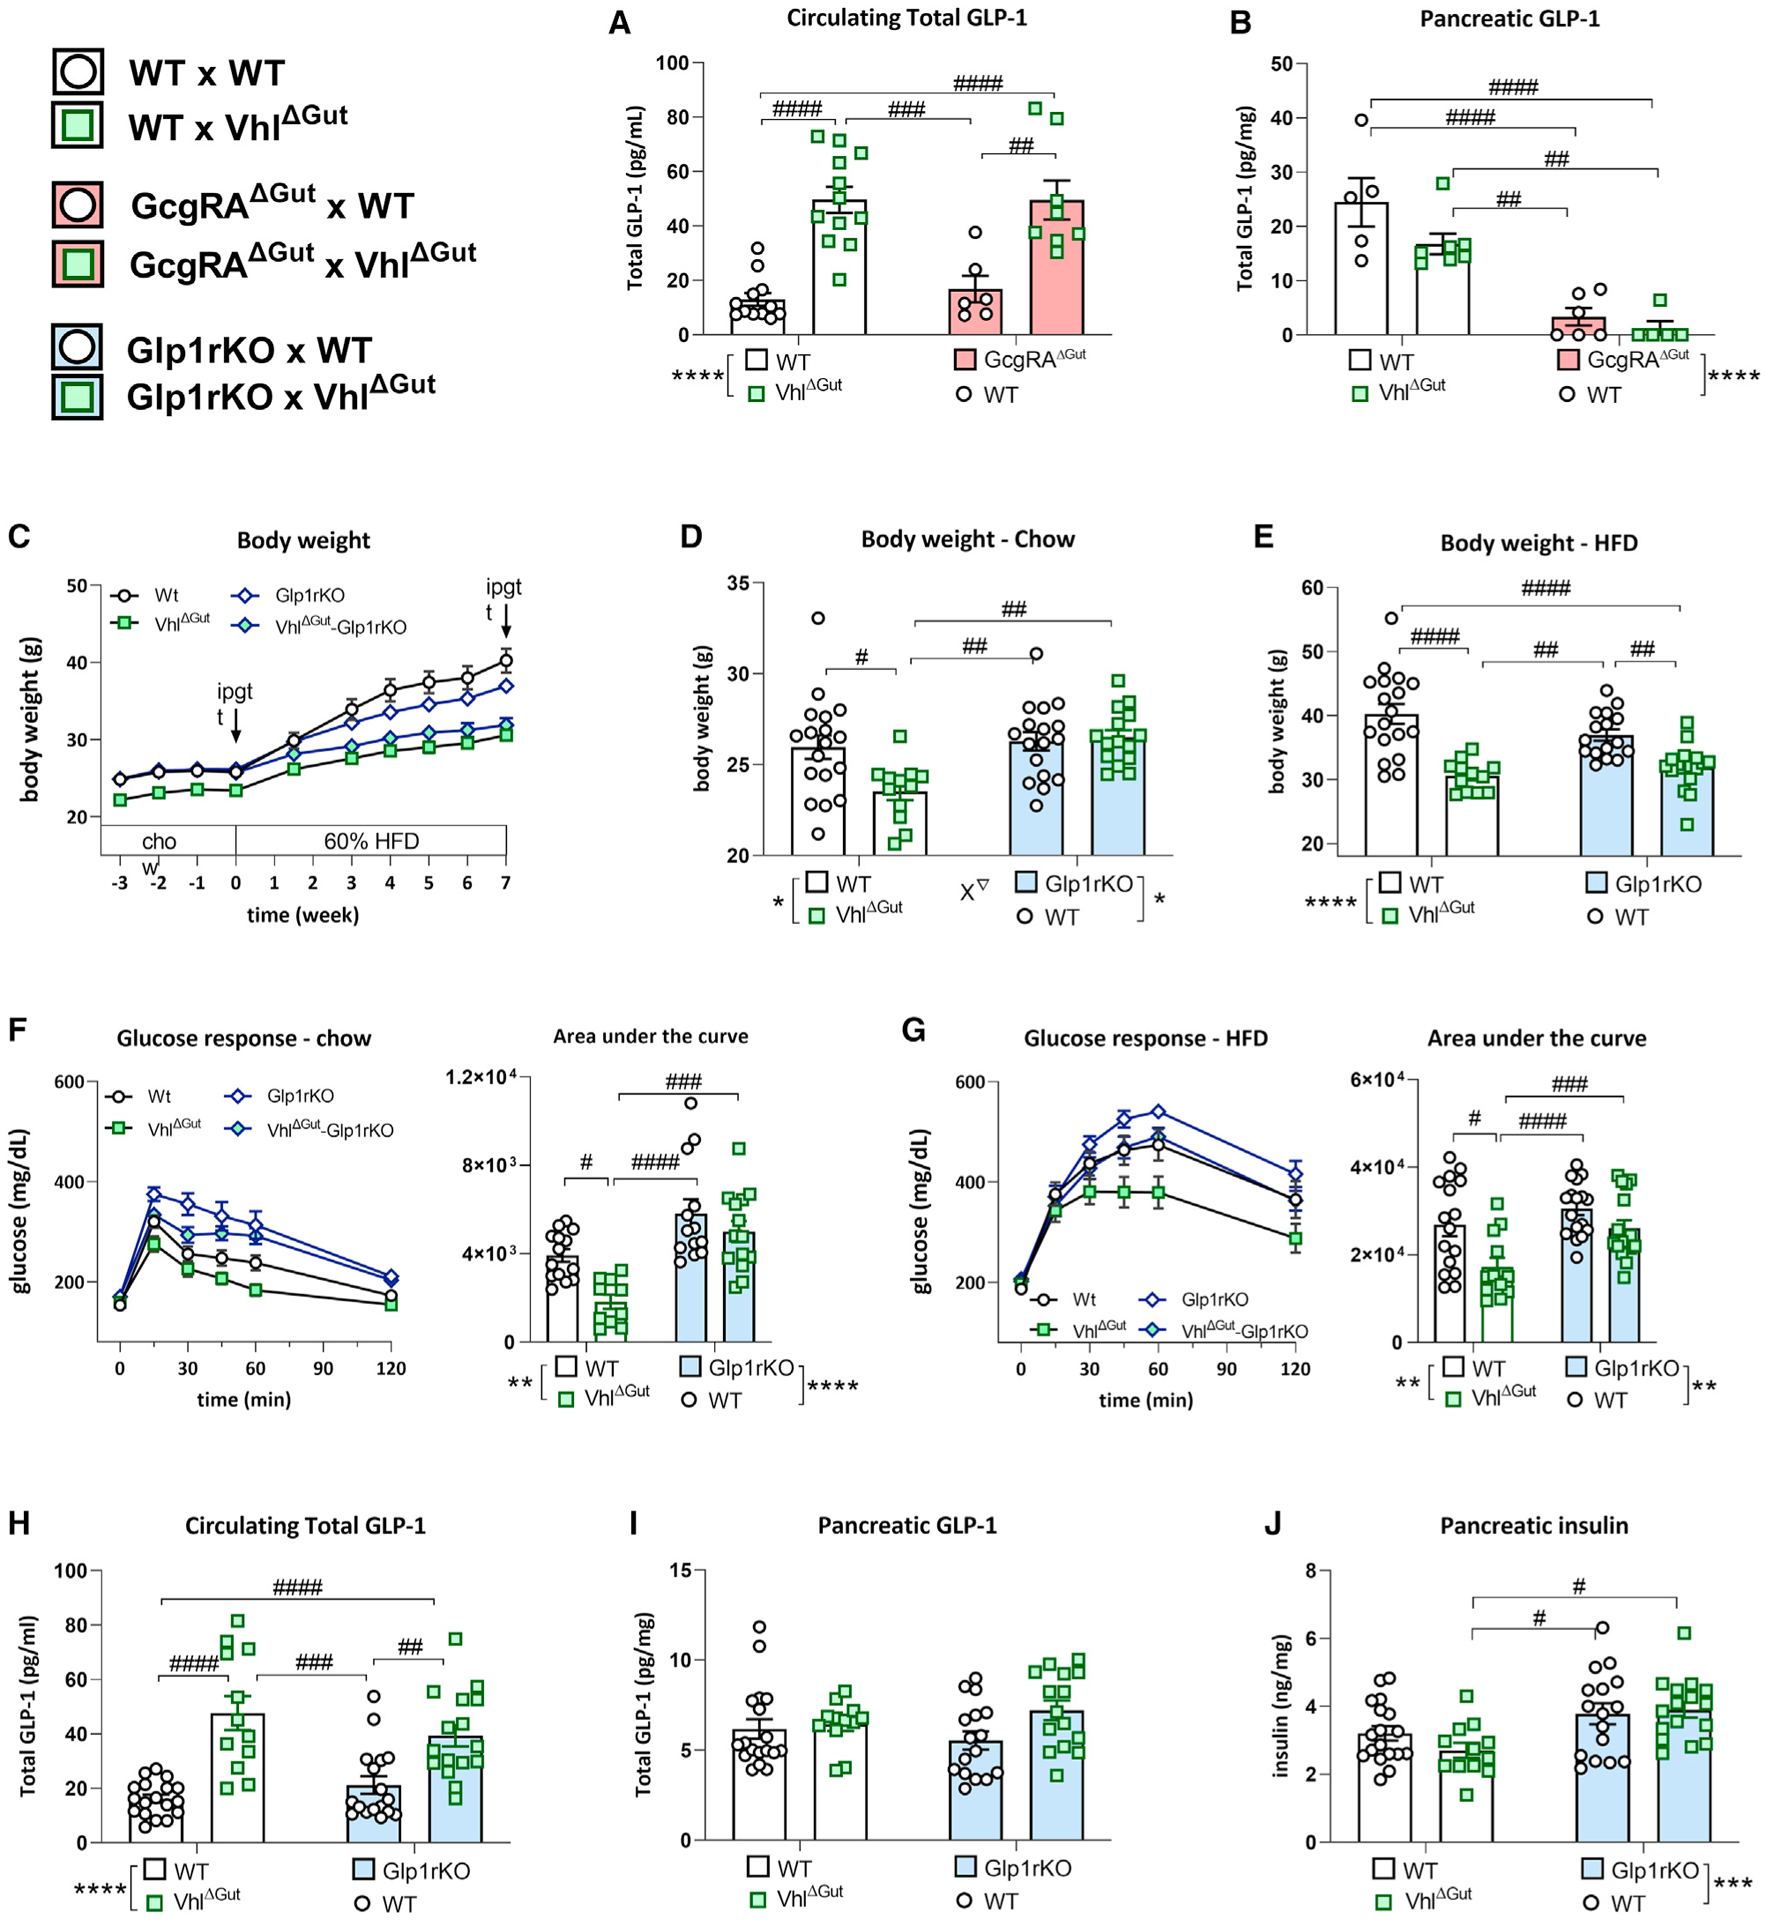
Figure 5. Diet-induced obesity resistance of the VhlΔGut depends on Glp1R signaling.

(A and B)The combination of VhlΔGut and intestinal Gcg reactivation (GcgRAΔGut) show that (A) increased circulating total GLP-1 levels in VhlΔGut mice (average ± SEM; WT × WT, n = 12; WT × VhlΔGut, n = 12; GcgRAΔGut × WT, n = 6; GcgRAΔGut ×VhlΔGut, n = 8; two-way ANOVA: F1,34 = 48.18, ****p < 0.0001 effect of VhlΔgut; ####p < 0.0001 post hoc Tukey test) originates from the intestine and not (B) from the pancreas (two-way ANOVA: F1,19 = 53.78, ****p < 0.0001 effect of GcgRAΔGut).
(C) Body weight over the duration of the study reveals that VhlΔgut mice are lower in body weight while fed a chow diet. During 7 weeks of 60% HFD diet feeding, VhlΔgut-Glp1rKO mice attenuate weight gain to the level of VhlΔgut mice, revealing that DIO resistance is not dependent on GLP1R action.
(D) Under standard chow diet conditions, VhlΔGut mice are lower in body weight compared with WT, Glp1rKO, or VhlΔGutGlp1rKO mice. Average ± SEM; WT × WT, n = 18; WT × VhlΔGut, n = 12; Glp1rKO × WT, n = 16; Glp1rKO × VhlΔGut, n = 15; two-way ANOVA: F1, 58 = 5.986, ∇p < 0.05 interaction, #p < 0.05, ##p < 0.01 post hoc Tukey test).
(E) Following 7 weeks of 60% HFD feeding, VhlΔGut are similar in weight to VhlΔgut-Glp1rKO mice. Two-way ANOVA: F1,58 = 40.66, ****p < 0.0001 main effect of VhlΔGut, #p < 0.05, ###p < 0.001, ####p < 0.0001 post hoc Tukey test.
(F) Under chow conditions, the lower glucose response during an ipGTT (2 g/kg glucose) in VhlΔGut mice depends on Glp1R action. Area under the curve: two-way ANOVA: F1, 47 = 29.49, ****p < 0.0001 main effect of Glp1rKO, **p < 0.01 main effect of VhlΔGut, #p < 0.05, ###p < 0.001, ####p < 0.0001 post hoc Tukey test).
(G) Under 60% HFD conditions, the lower glucose response during an ipGTT in VhlΔGut mice does depend on Glp1r action. Area under the curve: two-way ANOVA: F1,58 = 46.75, ****p < 0.0001 main effect of VhlΔGut; F1,58 = 6.951, ∇p < 0.05 interaction, ##p < 0.01, ####p < 0.0001 post hoc Tukey test.
(H and I) VhlΔGut and VhlΔGutGlp1rKO mice have increased circulating total GLP-1 levels (two-way ANOVA: F1,34 = 48.18, ****p < 0.0001 main effect of VhlΔGut, ##p < 0.01, ###p < 0.001, ####p < 0.0001 post hoc Tukey test) but (I) comparable levels of pancreatic GLP-1.
(J) Pancreatic insulin was higher in the Glp1rKO groups compared with VhlΔGut. Two-way ANOVA: F1,58 = 12.43, ***p < 0.001 main effect of Glp1rKO, #p < 0.05 post hoc Tukey test).
