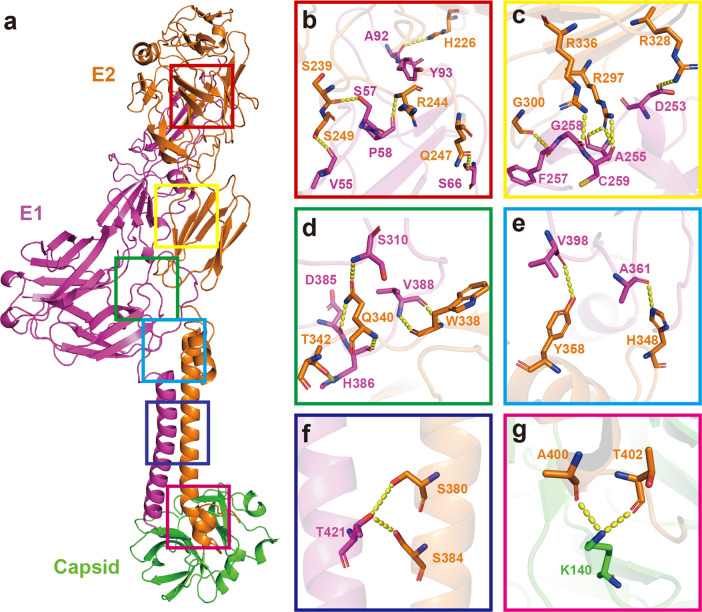
Fig. 2. Interaction of GETV protein subdomains in the E1–E2–Capsid heterotrimer.
a Distribution of interaction regions between E1 and E2 and between E2 and the capsid protein. b–f Zoomed-in views from a of the interaction regions between E1 and E2. g Zoomed-in view from a of the interaction region between E2 and the capsid protein. The yellow dashed lines indicate the distance between the atoms involved in the interaction (the cut-off distance is 3.5 Å).

