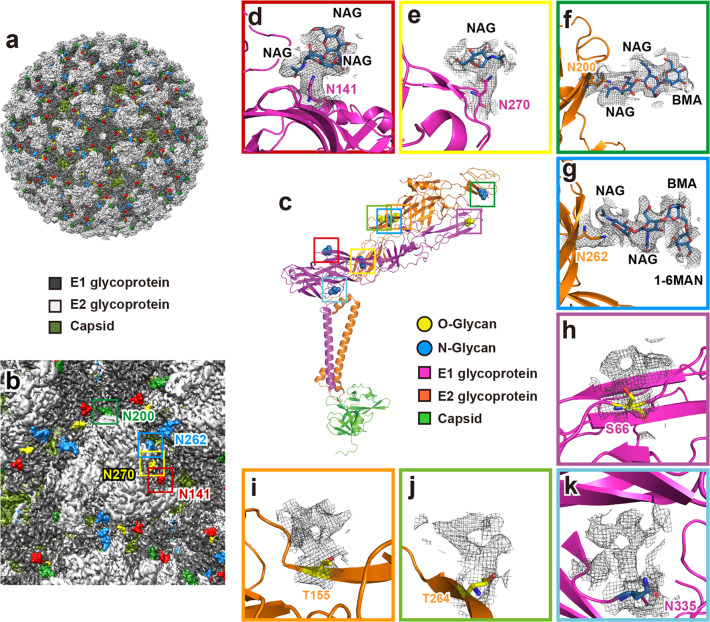
Fig. 5. Atomic models of glycans fitted in the density maps in the E1–E2 ectodomain.
a External surface of a GETV virion, with glycosylation sites displayed in color (E1 N141 in red, E1 N270 in yellow, E2 N200 in green, and E2 N262 in blue, respectively). b Zoomed-in view of the external surface close to the icosahedral 3-fold vertices; the glycosylation sites are framed and labeled using the same color scheme as shown in panel a. c Glycosylation sites in the atomic model of E1–E2–Capsid heterotrimer. d–g Zoomed-in views of N-glycosylation sites with residues shown as sticks (N141 and N270 in E1 are in purple, and N200 and N262 in E2 in orange). Cryo-EM densities attributed to glycans are shown as mesh; the atomic models for the glycans are shown as blue sticks. The names of carbohydrate monomers are labeled. N-Acetyl-glucosamine (NAG) and mannose (BMA: β-d-mannose; 1-6MAN: α-(1-6)-d-mannose) were assigned as the hexosamine and hexose monomers based on cryo-EM density map interpretation and models previously built for MAYV25. h–k Zoomed-in views of glycosylation sites with residues shown as sticks; cryo-EM densities attributed to glycans are shown in the mesh. Although protruding densities adjacent to S66, T155, T264, and N335 are strong, these did not support precise fitting for glycan atomic models.

