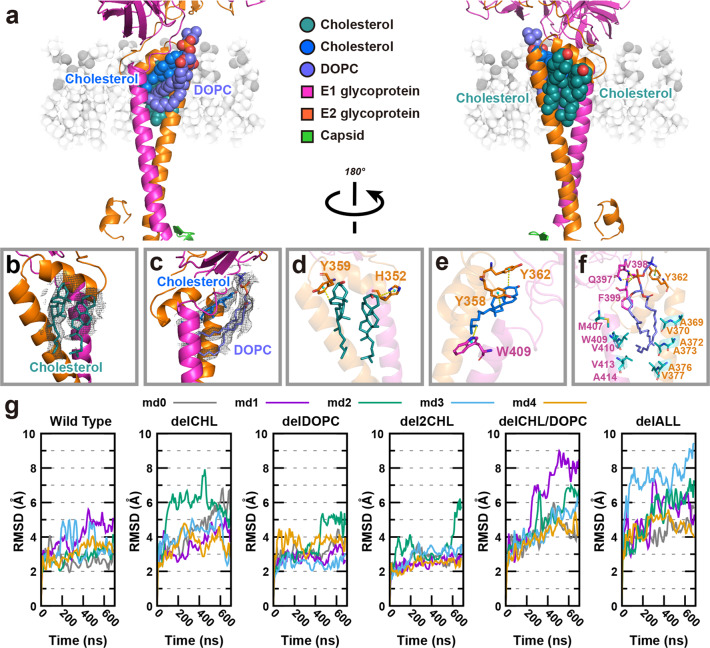
Fig. 7. Cholesterol molecules and a phospholipid DOPC in the hydrophobic pocket.
a Overview of the distribution of cholesterols and a phospholipid molecule DOPC. Cholesterol (blue) and DOPC (slate) are in the hydrophobic pocket formed by the E1 TM helix, the E2 TM helix, and E2 domain D. The other two cholesterols (deep teal) are positioned on the other side of domain D. E1 and E2 are presented as cartoons. The involved cholesterols and DOPC are presented as spheres, and the outer leaflet of the viral envelope membrane is shown in the background. b, c Zoomed-in views of cholesterols and DOPC molecules, which are shown as sticks. Cryo-EM densities attributed to the cholesterols and phospholipid are shown as mesh. d–f Zoomed-in views of the interactions between cholesterol or DOPC and E1 or E2. The aromatic residues positioned near the cholesterol or DOPC are shown as sticks with the same color as E1 or E2. The hydrophobic residues positioned near the tail of DOPC are shown as sticks. The center of mass of aromatic ring is shown as nb_spheres, colored in cyan. The yellow dashed lines represent the hydrogen bonds. A portion of the hydrogen bonds is CH–π hydrogen bonds between the soft acids CH and a soft base π-electron system. The remaining portion is common hydrogen bonds between the phosphate group of DOPC and Q397, V398 or F399. g Time evolutions from MD simulation analysis for the Cα-RMSD of E1 (295–435) and E2 (269–422) for systems “Wild Type”, “delCHL”, “delDOPC”, “del2CHL”, “delCHL/DOPC”, and “delALL”. All curves were smoothed with the Bezier method, implemented in gnuplot.

