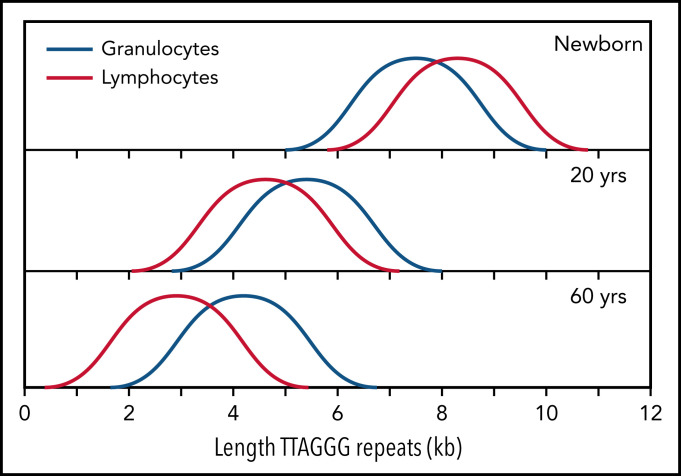
Figure 3.
Normalized telomere length distribution in lymphocytes and granulocytes from normal, healthy individuals at the indicated ages. Data for schematic distributions are shown in Figure 2. Calculated length of telomere repeats rather than data compatible with terminal restriction fragment (TRF) results are shown by subtraction of 3 kb of subtelomeric DNA (included in TRF values and data shown in Figure 2). Note that the age-related decline in telomere length is not linear over time and is more pronounced in lymphocytes than in granulocytes.

