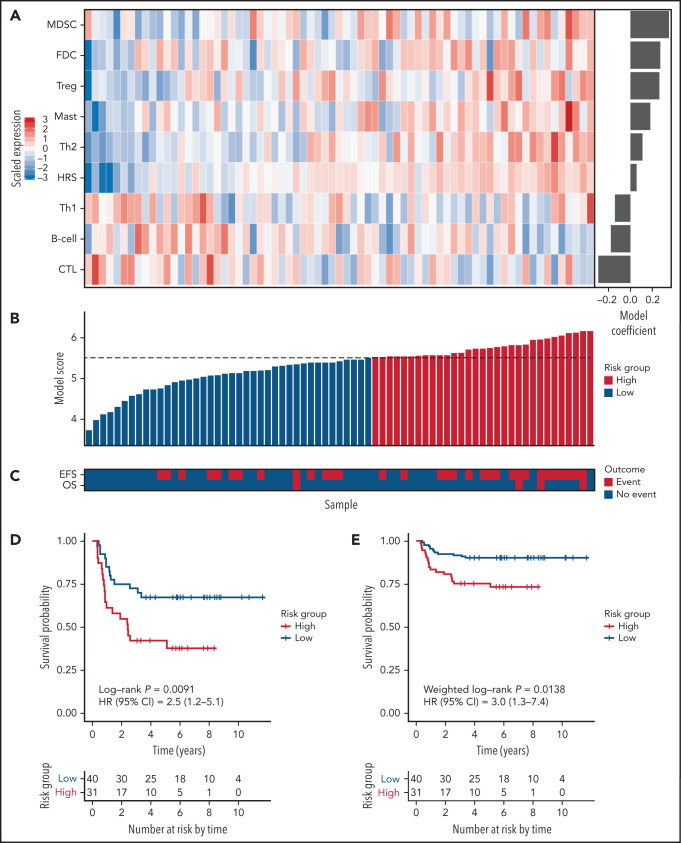
Figure 1.
The 9-cellular component model PHL-9C for pediatric cHL applied to the independent validation cohort. (A) Scaled gene expression values of the 9 cellular components in the prognostic model for pediatric cHL. Columns represent patients arranged by their individual model score, and rows represent cellular components arranged by their model coefficient. Bar plot of the model coefficients for each cellular component (right). (B) Model scores for the 9-cellular component model colored by risk class as defined by the model score threshold (dotted line). (C) Survival outcomes of patients in the validation cohort. Kaplan Meier estimates of EFS in the independent validation cohort using nonweighted analysis (D) and weighted analysis (E). Because the validation cohort was enriched for events, weighted analysis was performed to estimate PHL-9C's performance in the AHOD0031 trial population. The number at risk indicates the number of patients in the validation cohort contributing to the weighted analysis.

