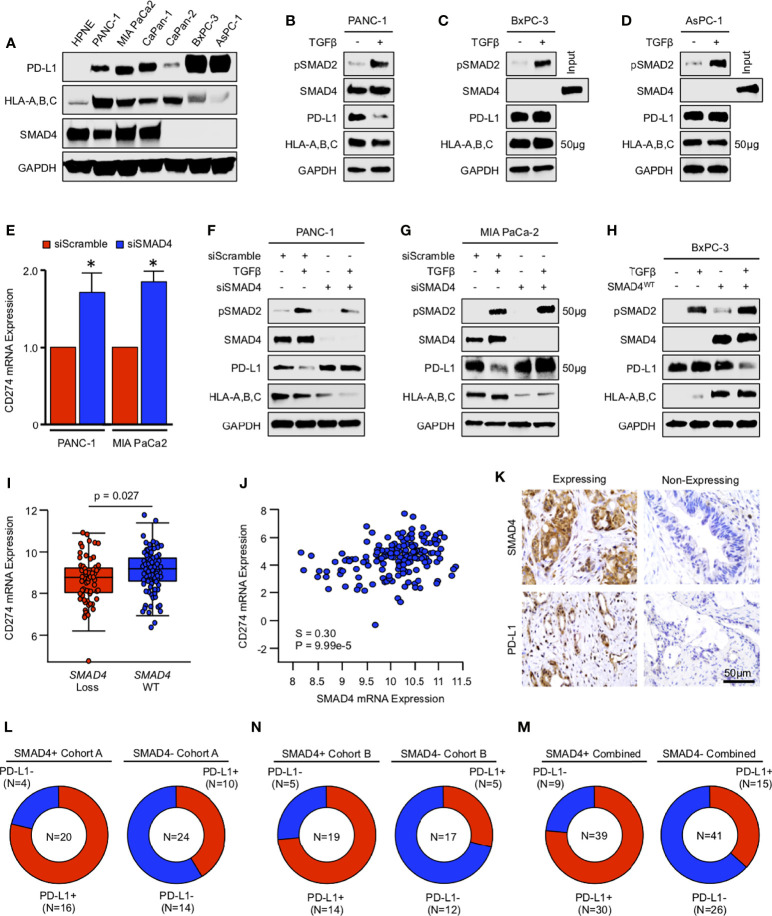
Figure 5.
TGFβ/SMAD signaling downregulates PD-L1 expression in vitro, yet SMAD4-intact tumors have higher expression of PD-L1 in vivo. (A) Non-malignant HPNE cells and human PDAC cell lines PANC-1, MIA PaCa-2, CaPan-1, CaPan-2, BxPC-3, and AsPC-1 were lysed and analyzed for basal expression of SMAD4, PD-L1, and HLA-A,B,C by western blot. (B-D) PANC-1, BxPC-3, and AsPC-1 cells were incubated with either a saline vehicle or 10ng/mL of recombinant TGFβ1 and evaluated after 24 hours by western blot. (E) PANC-1 and MIA PaCa-2 cells were incubated with either a control siRNA (siControl) or siRNA against SMAD4 (siSMAD4), and after 24 hours, CD274 (PD-L1) mRNA was evaluated by qPCR. (F, G) PANC-1 and MIA PaCa-2 cells were incubated with either siControl or siSMAD4 and, after 24 hours, stimulated with 10ng/mL of recombinant TGFβ1. Cells were lysed after another 24-hour period and evaluated by western blot analysis. (H) BxPC-3 cells were transfected with a wild-type SMAD4 plasmid (SMAD4WT). After 24 hours, cells were stimulated with 10ng/mL of recombinant TGFβ1 and evaluated by western blot analysis after another 24 hours. (I) Using the TCGA genomic database of pancreatic cancer patients (N=186), the 149 fully sequenced tumors were separated into two groups: those with no SMAD4 alteration (SMAD4 wild-type or WT), and those with presumptive SMAD4 loss via a known inactivating mutation, mRNA downregulation, and/or copy number deletion. We then compared the mRNA expression of CD274 in each group. (J) SMAD4 mRNA expression was plotted against that of CD274. All mRNA expression values are plotted in log scale and are displayed with the associated p and Spearmen (S) coefficient values. (K) Excisional biopsies from two cohorts of PDAC patients (N=44 and N=36, respectively) were sectioned and stained via immunohistochemistry for SMAD4 or PD-L1. (L-N) Patients were grouped as being either SMAD4-expressing (SMAD4+) or SMAD4-non-expressing (SMAD4-), and the percent of each group also positive for PD-L1 displayed as a pie chart. (*p < 0.05).

