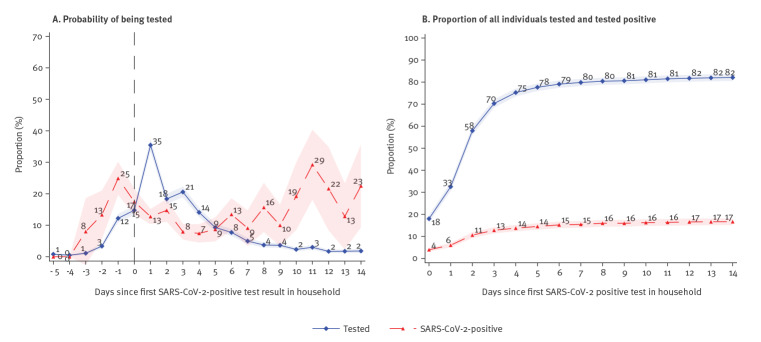
Figure 2.
Dynamics of SARS-CoV-2 testing, Denmark, 18 May–5 July 2020 (n = 3,216 individuals; 990 households)
SARS-CoV-2: severe acute respiratory syndrome coronavirus 2.
A. t = 0 denotes the time of receiving the first positive test result in a household. On the day preceding the result (t = − 1) 12% were tested and 25% of these tested positive. The day after the households received their first positive test result (t = 1), 35% were tested and 13% of these tested positive.
B. t = 0 denotes the time the first positive test was taken (not when the test result was given). 18% of all potential secondary cases were tested on the same day as the primary case (t = 0) and 4% of all potential secondary cases tested positive. This implies a 22% probability of testing positive conditional on being tested on the same day as the primary case. Fourteen days after the day of the first positive test, 82% had been tested and 17% tested positive.
Data shown refers to the late reopening phase (18 May 2020 to 5 July 2020). Shaded areas show the 95% confidence bands clustered on household level.

