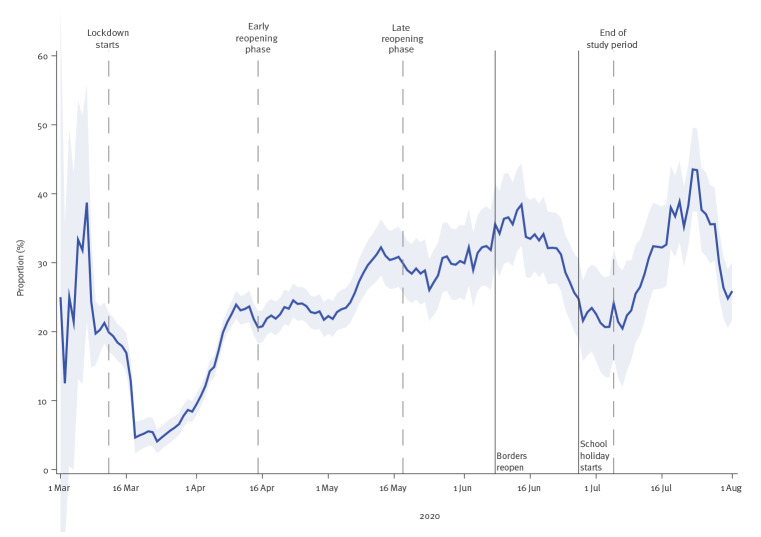
Figure 3.
Proportion of total SARS-CoV-2-positive cases originating from households, Denmark, 1 March–1 August 2020 (n = 13,082)
SARS-CoV-2: severe acute respiratory syndrome coronavirus 2.
This figure shows the proportion of positive tests originating from households, as defined by new cases that live in a household with another case that tested positive within the preceding 14 days. The figure shows a 7-day moving average, while the shaded area shows the 95% confidence bands with standard errors clustered on the individual level.

