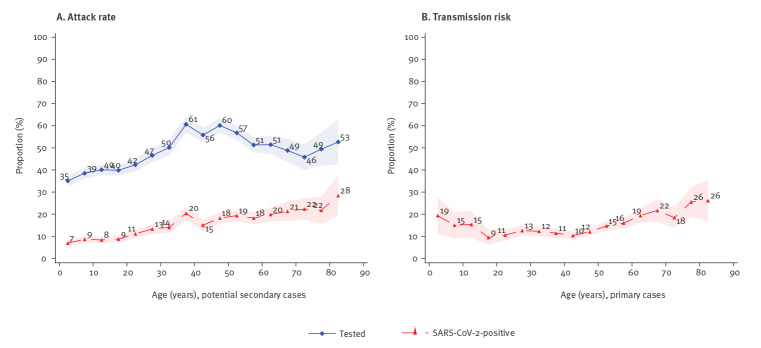
Figure 4.
Age-structured attack rate (A) and transmission risk (B) of SARS-CoV-2 transmission in households, Denmark, 12 March–5 July 2020 (n = 21,015 individuals; 6,782 households)
SARS-CoV-2: severe acute respiratory syndrome coronavirus 2.
A. This figure shows the probability of having a test (blue) and the probability of having a positive test (red) (unconditional on being tested) across 5-year age groups.
B. This figure shows the transmission risk from primary cases by age group, i.e. the probability of infecting others.
The shaded areas show the 95% confidence bands clustered on the household level.

