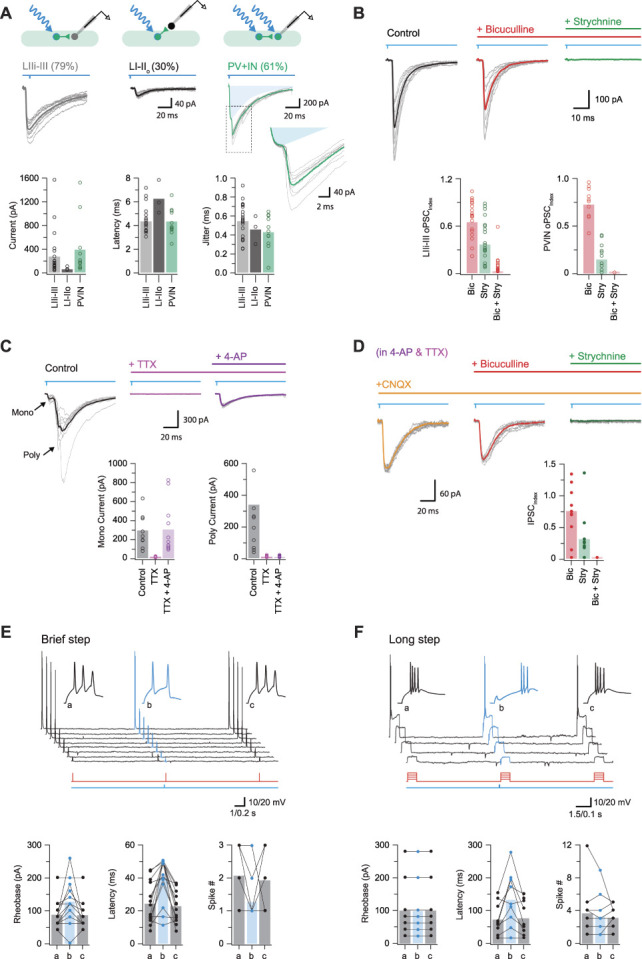
Figure 5.

Inhibitory parvalbumin-expressing interneurons (iPVINs) provide mixed, glycine-dominant postsynaptic inhibition. (A) Upper schematics show the 3 recording configurations used to study monosynaptic connections: iPVIN to lamina IIi-III neurons, iPVIN to lamina I-IIo neurons, and iPVIN to PVIN. Voltage-clamp recordings (−70 mV) showing optically evoked inhibitory postsynaptic currents (oIPSCs) in lamina I-IIo neurons, lamina IIi-III neurons, and PVINs (10 consecutive sweeps and average overlayed). Blue shading in PVIN trace denotes underlying photocurrent isolated by a pharmacological block of synaptic events. Group data right compare oIPSC amplitude, latency, and latency standard deviation (jitter). (B) Representative oIPSC recording in CNQX (black) and after sequential bath application of bicuculline (red) and strychnine (green). Group data below summarise the effect of these drugs in lamina IIi-III neurons (left) and PVINs (right), highlighting glycine-dominant oIPSCs (ie, the IPSC index is most reduced by strychnine). (C) Representative photostimulation (black) and after sequential bath application of TTX (pink) and 4-AP (purple). Addition of TTX blocks the action potential–dependent oPSCs, which can be recovered by addition of 4-AP. Group data below summarise effects of drug application on monosynaptic currents (bottom left) and longer-latency polysynaptic currents (bottom right), highlighting the drug cocktail's ability to isolate monosynaptic responses. (D) Traces from the same recording in C (in TTX and 4-AP) after sequential addition of CNQX, bicuculline, and strychnine. Bicuculline produced a moderate reduction in the oIPSC amplitude and strychnine abolished the response. Group data below summarise this pharmacology with the oIPSC index reduced to ∼0.75 in bicuculline, ∼0.25 in strychnine, and abolished in both drugs. (E) Top traces show AP discharge responses recorded in a lamina IIi-III neuron during brief (50 ms) depolarizing step injections: (a) pretest step, (b) test step—preceded by a PVIN photostimulation, and (c) posttest step (timing of current steps in red and photostimulation in blue, below). Insets show the AP onset on expanded time. Group data plots below summarise group data showing rheobase, latency, and number of spikes in response to stimulation are all altered by preceding activation of PVINs and the associated inhibition they mediate. (F) Plot shows same general experimental approach as in (D); however, depolarizing current injections were of longer duration (500 ms). Under these conditions only spike latency was altered by preceding PVIN photostimulation, whereas rheobase and spike number were unchanged.
