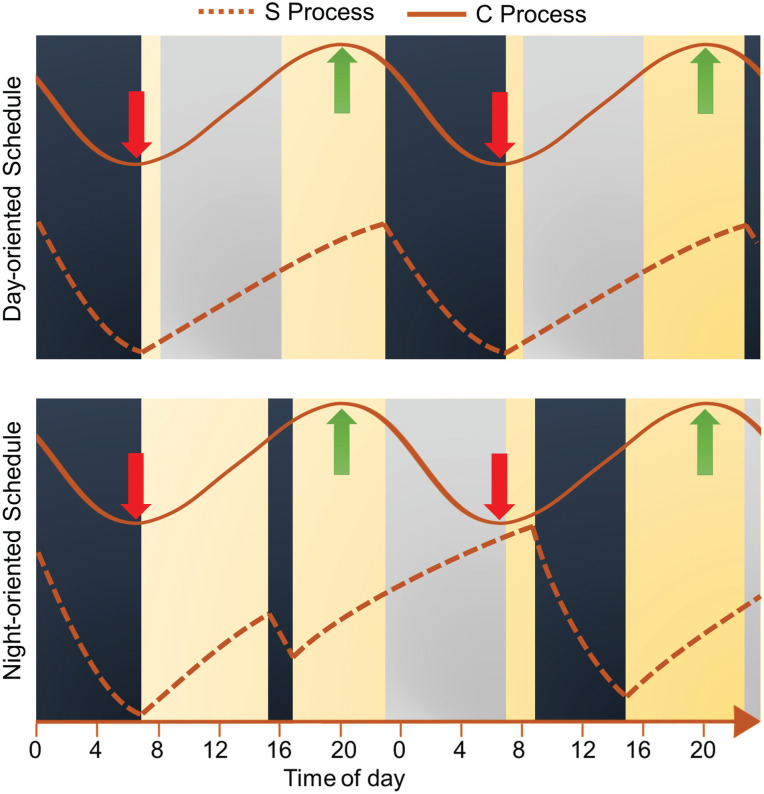
Figure 2.
Sleep propensity as regulated by the homeostatic and circadian processes. The S process illustrates the homeostatic sleep drive, whereas the C process illustrates the wake propensity rhythm. The upper panel represents a person living on a day-oriented schedule, whereas the lower panel represents a person doing a first night shift after a nap in the afternoon. The strength of each process increases from bottom to top. Work shifts are represented by gray rectangles, sleep and nap periods by dark blue rectangles, and wake periods in yellow. Red and green arrows identify the circadian nadir and peak of wake propensity, respectively. During a typical workday, the circadian nadir of alertness occurs at the end of the nocturnal sleep period when the homeostatic drive for sleep is low. At the end of the first night shift, the circadian nadir of alertness occurs at the end of the night shift when the homeostatic drive for sleep is very high.

