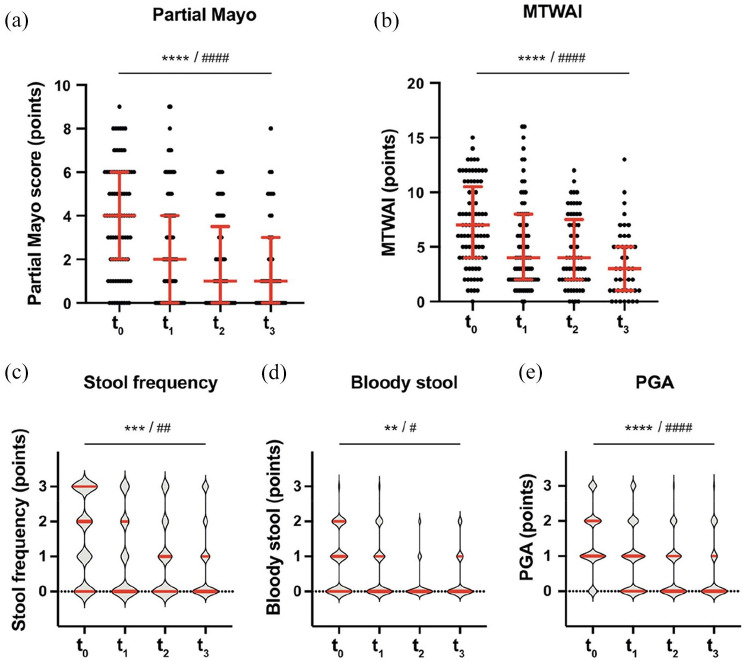
Figure 3.
Clinical efficacy of golimumab treatment. The medians and interquartile ranges are indicated by bars. Statistical analysis: linear mixed-effects model calculating fixed effects of time. Significance for the time trend are indicated without multiple test correction: (*)p < 0.1; *p < 0.05; **p < 0.01; ***p < 0.001; ****p < 0.0001, and after Bonferroni-correction for 10 independent tests in Figures 3 and 4: #q < 0.05; ##q < 0.01; ###q < 0.001; ####q < 0.0001. Mann–Whitney U test.
MTWAI, modified Truelove and Witts activity index; PGA, physician’s general assessment.

