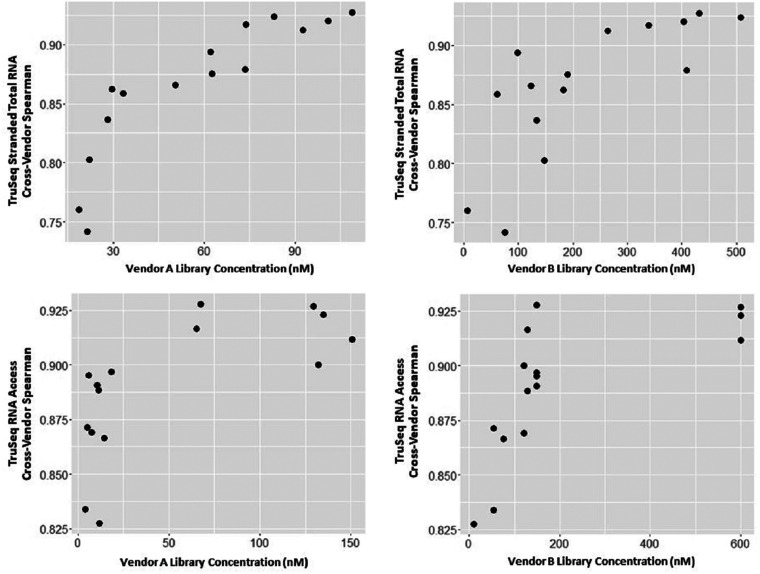
Figure 4.
Cross-vendor correlation versus library concentration. Examination of the cross-vendor correlations compared to various common QC statistics suggested that the library concentration was most informative in predicting the cross-vendor correlation. Plotted here are the cross-vendor correlation values versus library concentration. For the TruSeq Stranded Total RNA kit, there is a trend of increasing (though perhaps nonlinear) correlation as library concentration increases. For TruSeq RNA Access kit, there appears to be notably better results from library concentrations above 50 nM.

