
Figure 1. The landscape of somatic driver mutations in melanoma.
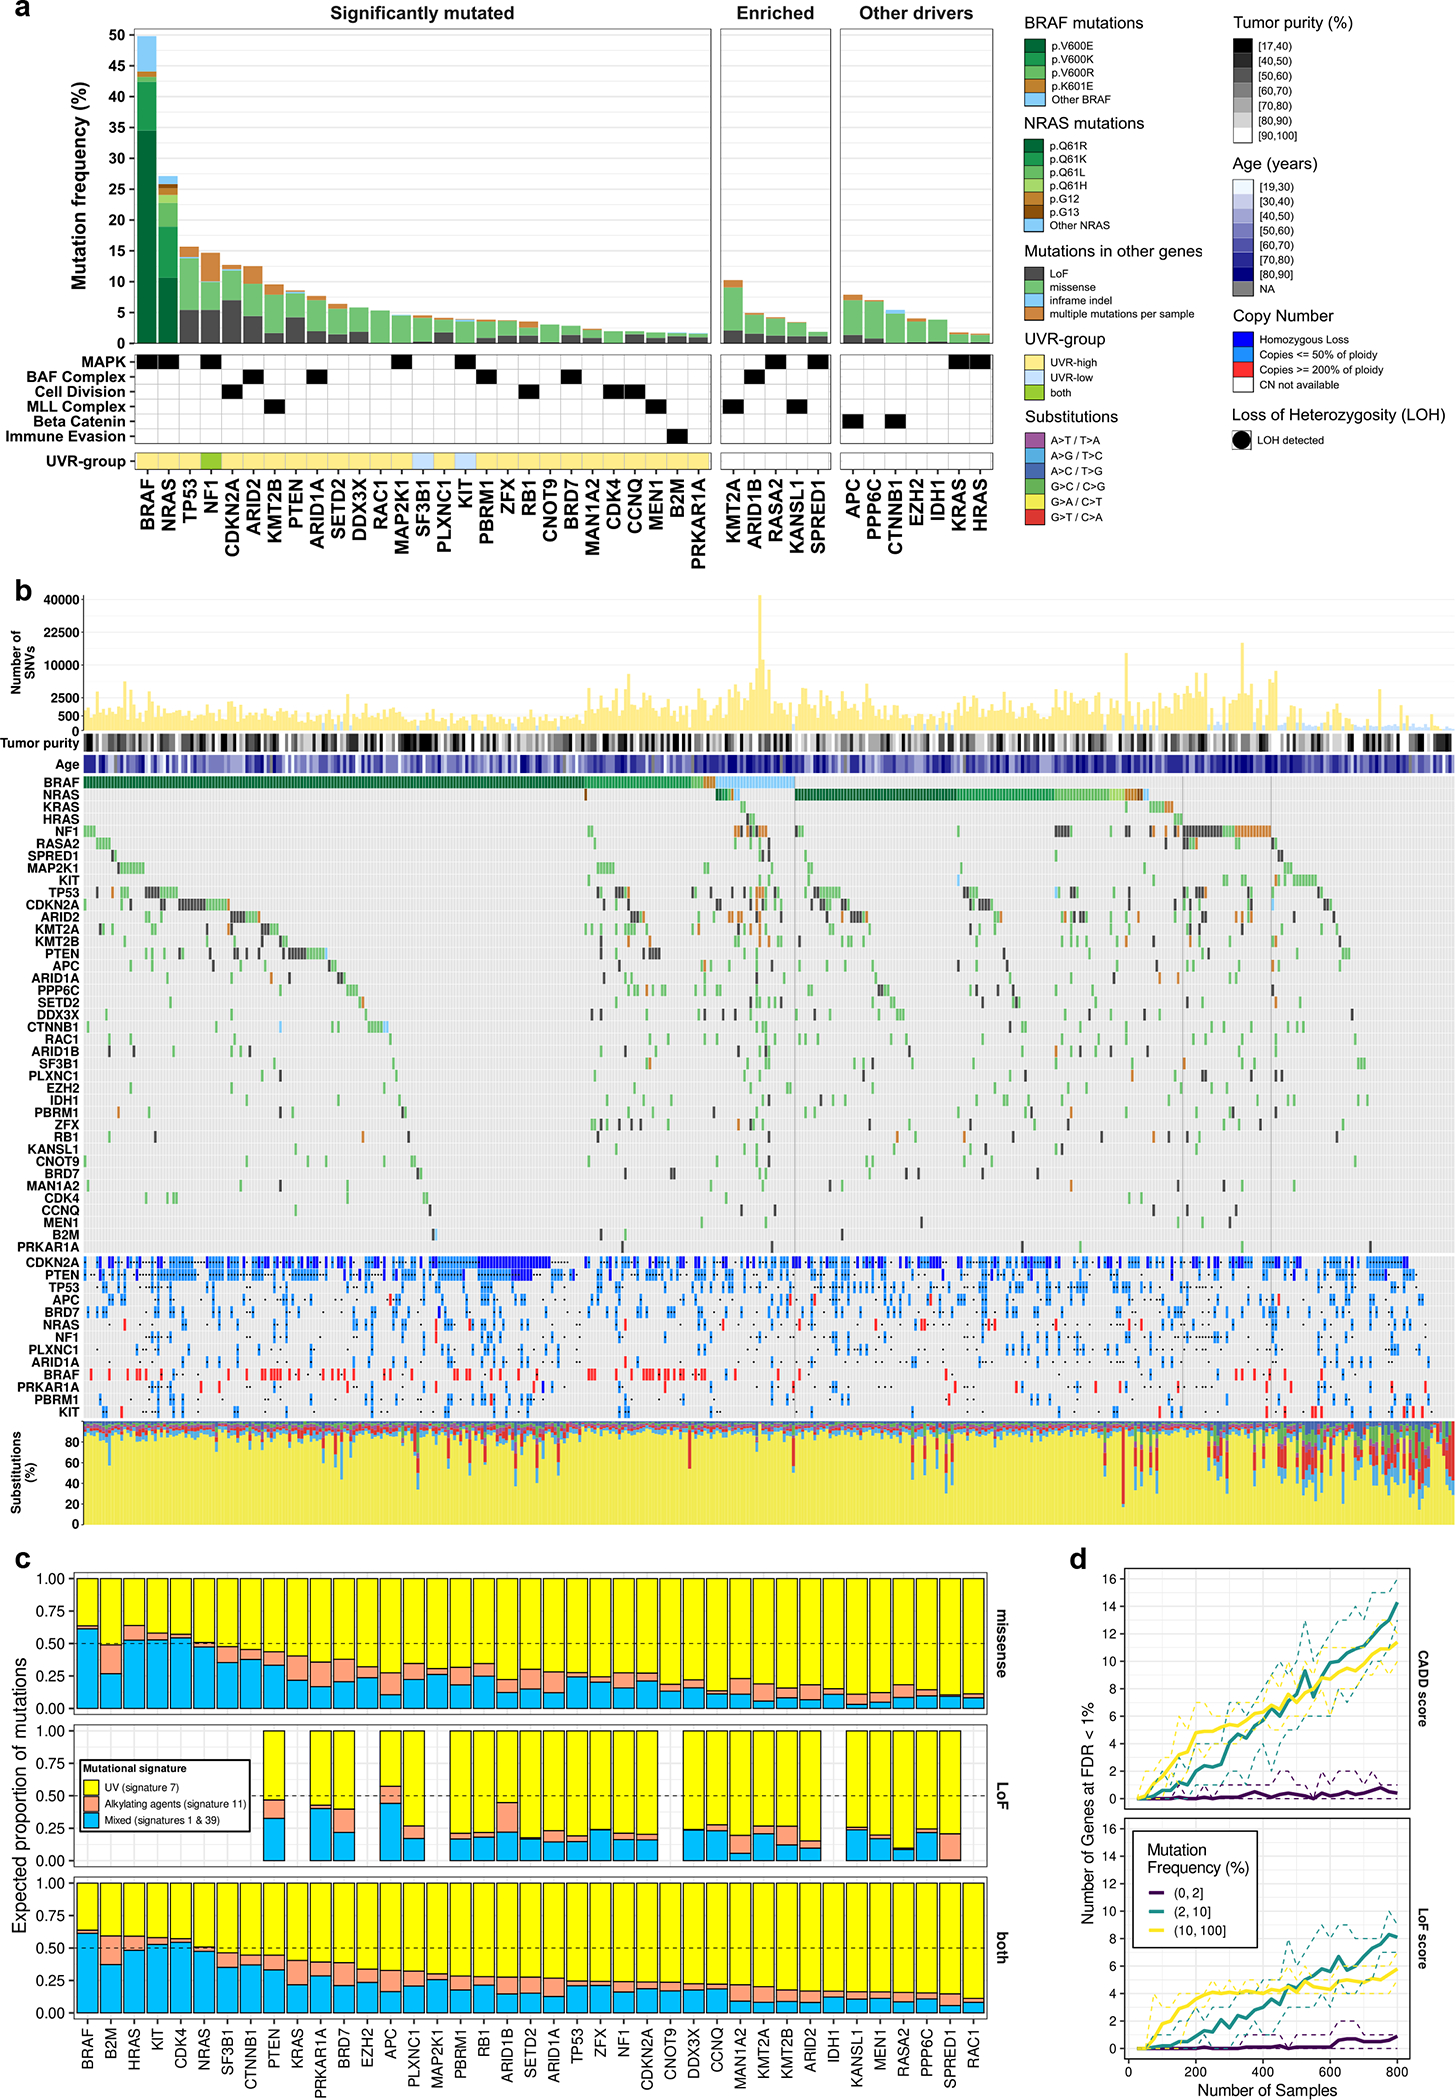
(a) Gene mutation frequencies in 1,014 melanoma tumors. Select biological roles are indicated by black boxes. The significantly mutated set (n = 27 genes) comprises genes inferred to undergo positive selection (OFML FDR < 1%). The UVR-group colour bar indicates whether a gene is significantly mutated in UVR-low or UVR-high tumors. The enriched set (n = 5 genes) comprises genes which passed a less conservative OFML FDR cut-off (<10%), selected based on their involvement in MAPK signalling, BAF, and MLL protein complexes. The other drivers set (n = 7 genes) comprises genes previously linked to melanoma. (b) Mutation and DNA copy number profiles of melanomas from the TCGA (n = 449 tumors). From top to bottom: (1) Number of single nucleotide variants (y-axis) per tumor (x-axis), plotted on a square root scale. (2) Tumor purity inferred by ABSOLUTE. (3) Patient age at the time of tumor sample procurement. (4) Gene-by-tumor matrix of mutations in significantly mutated genes, enriched genes, and other drivers. (5) Gene-by-tumor matrix of copy number alterations in genes that exhibited co-occurrence of mutations and loss-of-heterozygosity (LOH) or DNA copy gain (p<0.05; one-tailed Fisher’s exact test). (6) Single nucleotide substitution frequencies per tumor. (c) Proportion of mutations per gene attributed to each mutational signature identified by NMF (n = 1,014 tumors). (d) Saturation analysis of SMG detection using OFML with CADD or LoF scores. The y-axes show the mean number of SMGs detected (FDR < 1%) across ten random subsamples of a given sample size, indicated on the x-axis. Genes are stratified by mutation frequency in UVR-high tumors (n = 824 tumors). Dotted lines correspond to the min and max values observed across the 10 replicates.