
Extended Data Figure 6. Deconvolution of melanoma transcriptomes using NMF.
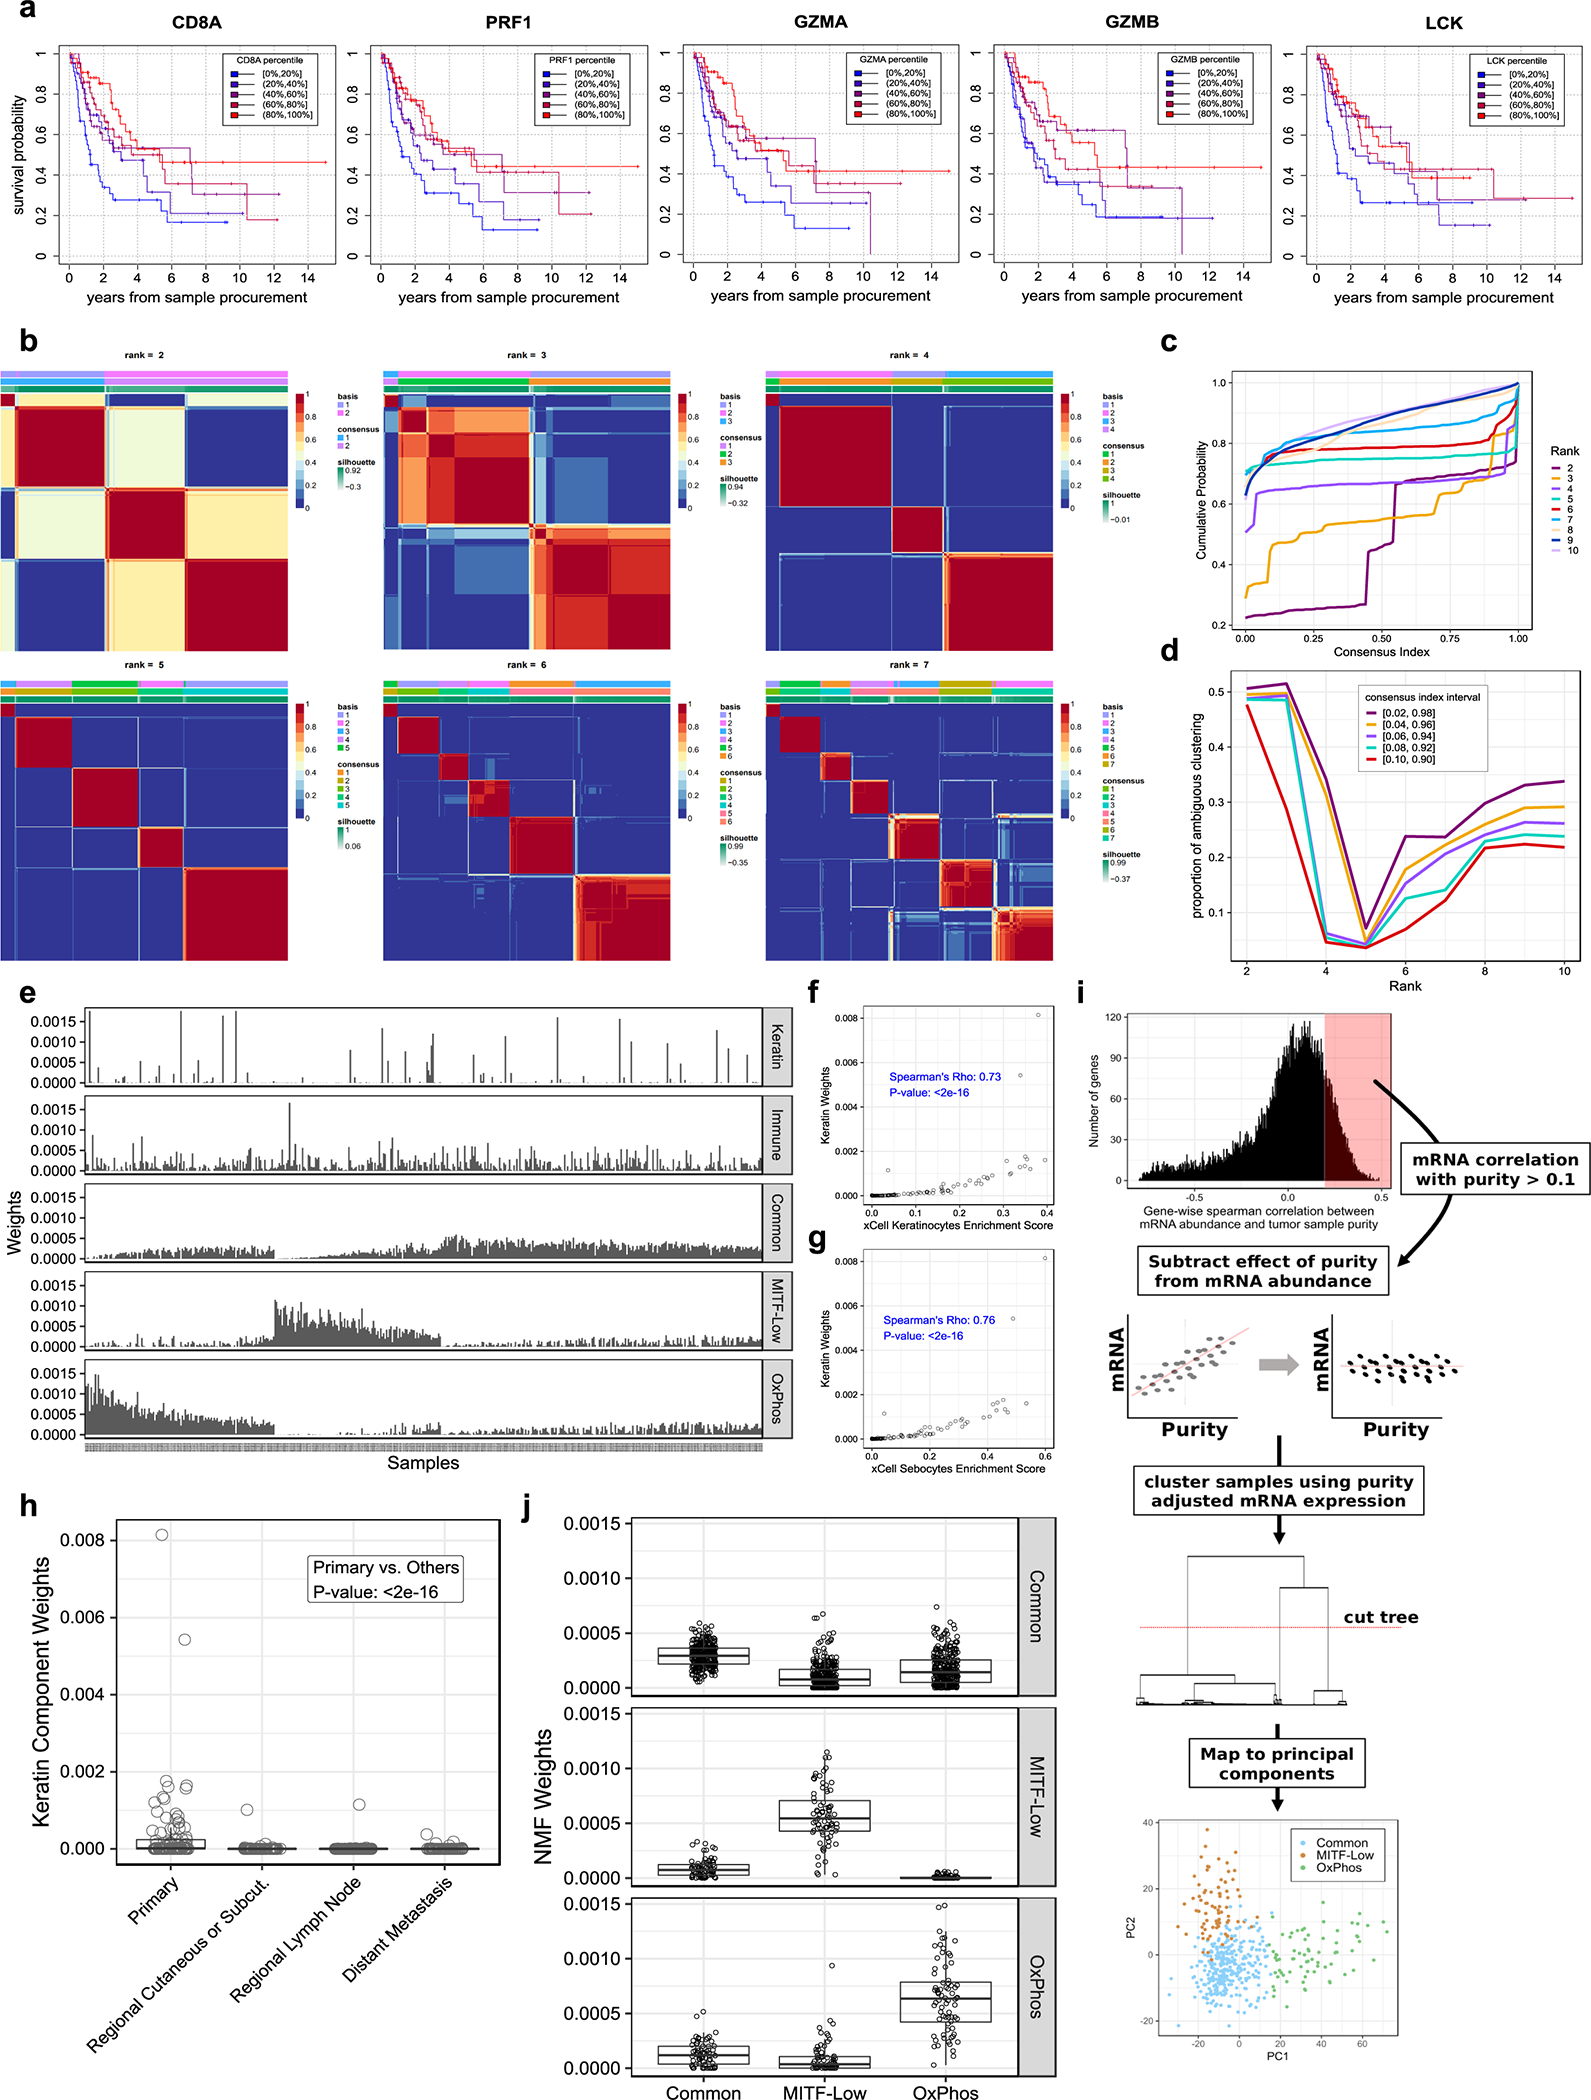
(a) Kaplan-Meier survival curves for 216 patients from TCGA with metastatic tumor samples from a regional lymph node, stratified by mRNA expression percentiles of lymphocytic markers. Each panel corresponds to one lymphocytic maker. (b-d) Determining the optimal NMF decomposition for RNA-seq data (n = 468 tumors). (b) Average of tumor sample connectivity matrices across 100 randomly initialized NMF runs. (c) Cumulative distribution function (CDF) of averaged tumor connectivity matrices. (d) Proportion of ambiguous clustering (PAC) by NMF – used to evaluate the stability of NMFs solution at each rank (k). PAC measurements using five different definitions of ambiguity are shown. (e-h) Distribution of NMF’s expression signatures and their relationship with non-melanocyte skin cells. (e) Distribution of NMF signature weights in TCGA tumors. (f and g) Scatter plots of each tumor’s NMF keratin weights (y-axis) and xCell keratinocyte and sebocyte signature scores (x-axis) (n = 468 tumors). Correlation p-value was computed using a two-sided Spearman’s test. (h) Distribution of keratin weights across TCGA tumor tissue sites (nprimary = 101 and nother = 362 tumor samples). Each point corresponds to one tumor sample. P-value is from a two-tailed Wilcoxon rank sum test. Boxes indicate first, second, and third quartiles. Whiskers extend to the minimum and maximum data points, no further than 1.5 times the inter-quartile range from the hinges. (i) Classical clustering recapitulates melanoma cell intrinsic expression signatures when the effect of varying tumor purity is subtracted from gene expression data. See methods for additional details. (j) Agreement between NMFs proposed cancer intrinsic signatures and the groups uncovered in (i). Each panel includes samples from a single mRNA subgroup identified in (i), indicated on the right side of the panel (nCommon = 299, nMITF-low = 76 and nOxPhos = 72 tumors). Shown on the y-axis are the NMF weights corresponding to each NMF signature indicated on the x-axis. Boxes indicate first, second, and third quartiles. Whiskers extend to the minimum and maximum data points, no further than 1.5 times the inter-quartile range from the hinges.