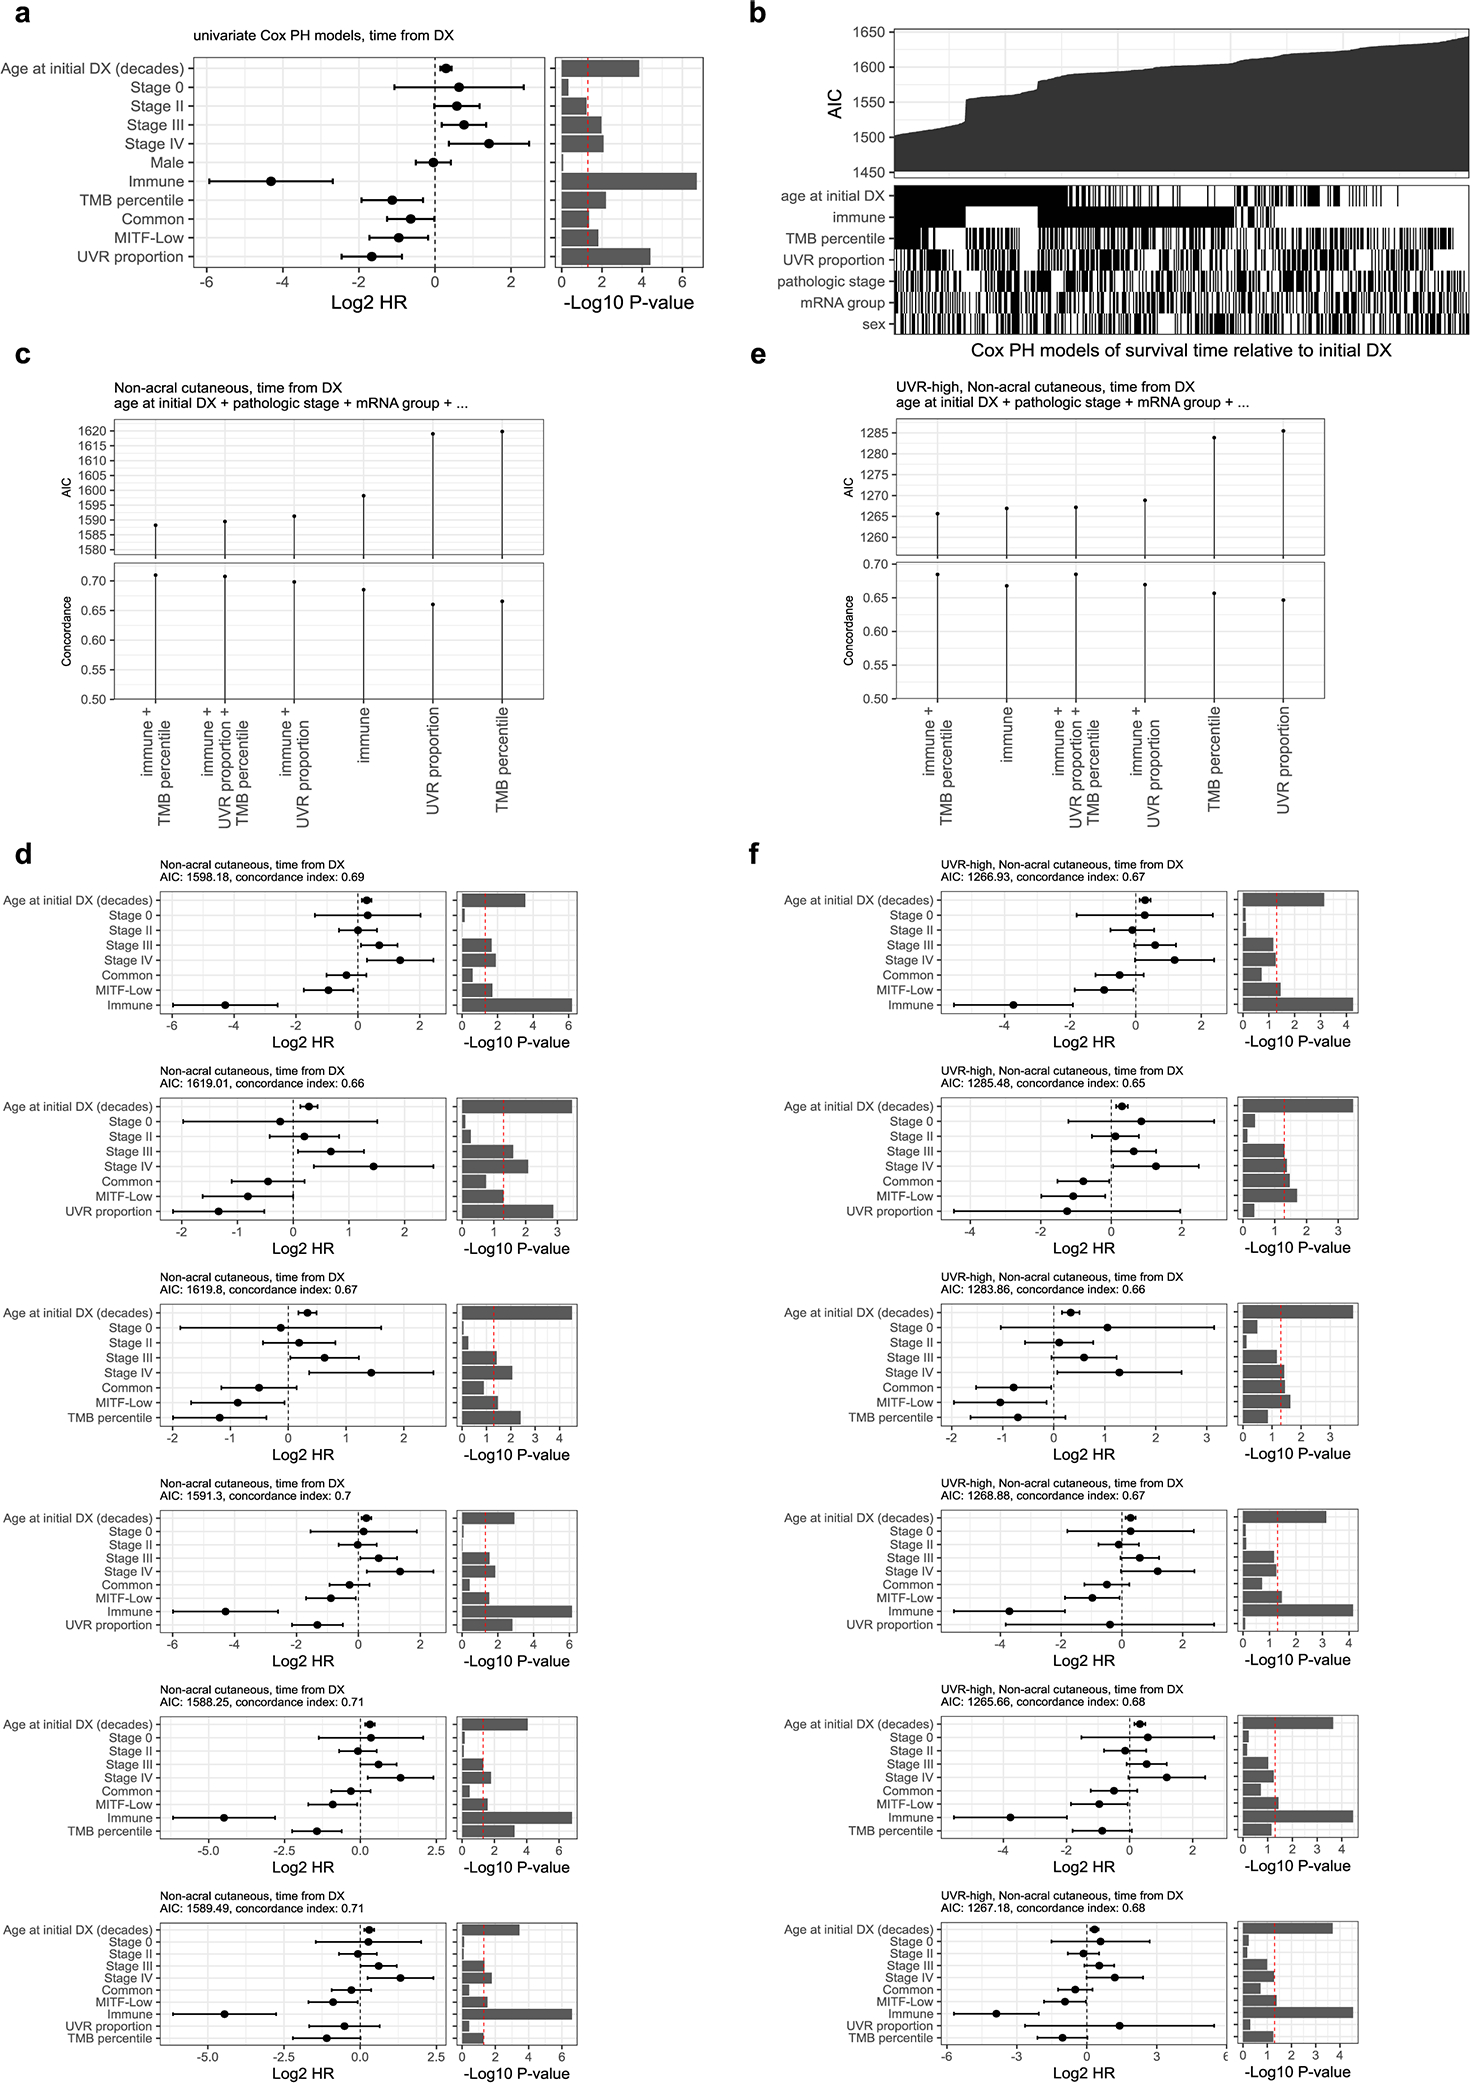
Extended Data Figure 9. Single predictors evaluation and relative quality of multivariable overall survival models in non-acral cutaneous melanomas.

(a) Univariable Cox model Hazard ratio and unadjusted p-value of single predictors (n = 347 tumor samples). (b) Relative quality of univariable and multivariable Cox survival models including all subsets of predictors. Models are ordered from left to right by increasing Akaike Information Criteria (AIC, top). The bottom panel (binary matrix) indicates which predictors were included in each model (n = 347 tumor samples). (c and e) Relative quality of multivariable Cox regression models including different subsets of predictors for unstratified (n = 347) and UVR-high (n = 301) tumor samples. All models include age at initial diagnosis, pathologic stage, and mRNA subgroup in addition to the predictors specified on the x-axis (indicated by ellipses). The y-axis shows the Akaike information criteria (AIC, top subpanel) and concordance index (lower subpanel). (d and f) Coefficients of the multivariable Cox regression models shown in (c) and (e). For each subpanel, the left part shows the coefficients, expressed in log2 hazard-ratios with 95% confidence intervals, and the right part shows the coefficient p-values. Cox model coefficient p-values in all panels were computed using a two-tailed z Wald test.
