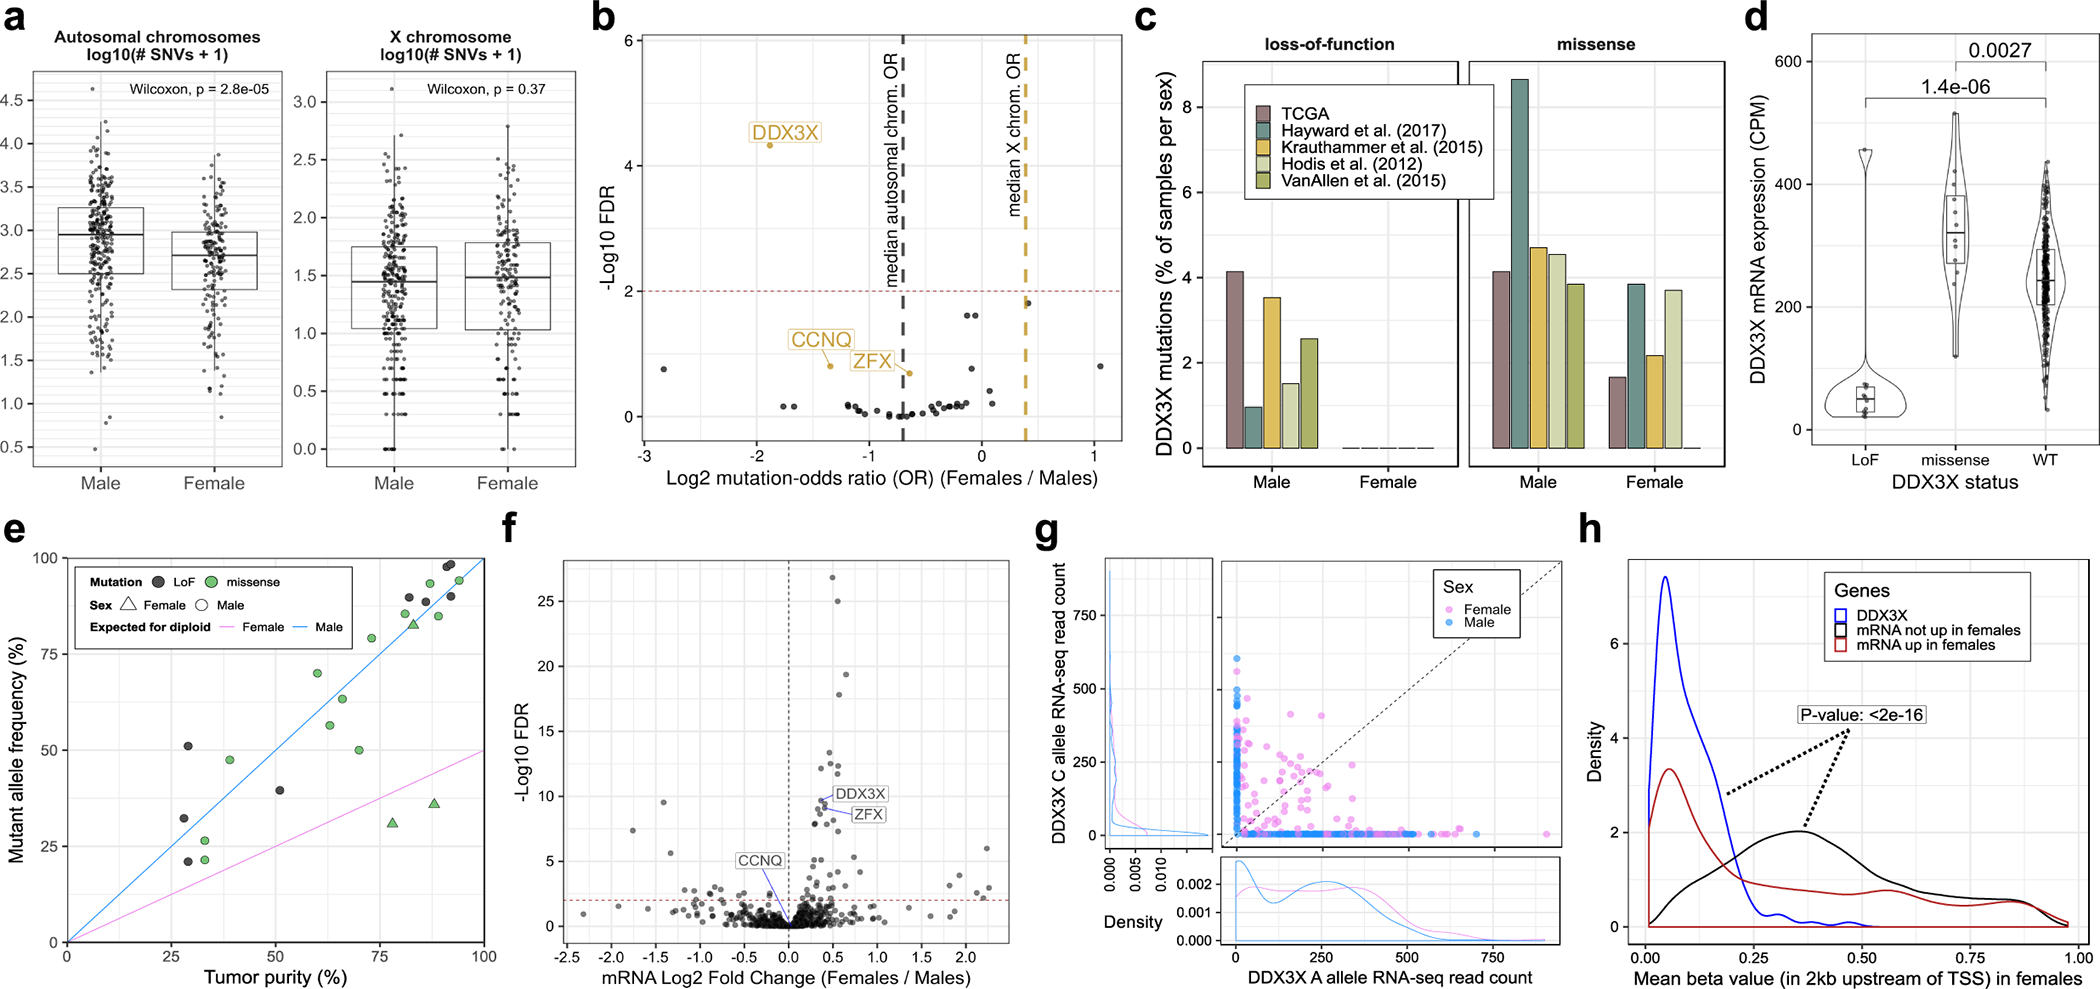
Figure 2. DDX3X is enriched in loss-of-function (LoF) mutations in males and escapes X-inactivation in females.

(a) Box and whisker plots showing the number of autosomal and X-chromosome single nucleotide variants (SNVs) in male (n = 623) and female (n = 390) melanoma tumors. Each point represents one tumor. Boxes indicate the first, second, and third quartiles. Whiskers extend to the minimum and maximum data points, no further than 1.5 times the inter-quartile range from the hinges. P-values are from a two-tailed Wilcoxon rank sum test. (b) Volcano plot showing the relationship between patient sex and the mutation frequencies of 39 driver genes considered in this study. Each point represents one gene. X-linked genes are labelled in gold. The x-axis shows the odds ratio (OR) of mutation in females (n = 390 tumors) relative to males (n = 623 tumors). The y-axis corresponds to FDR-adjusted p-values from a two-tailed Fisher’s exact test of divergence from the expected OR, denoted by a dark grey dotted line for autosomal genes and gold dotted line for X-linked genes. A horizontal red dotted line marks the FDR cut-off of 1%. (c) Frequency of DDX3X LoF in females and males, stratified by patient cohort. (d) Box and whisker plot of DDX3X mRNA expression in male TCGA tumors, stratified by DDX3X mutation status (nLoF = 12; nmissense = 12; nWT = 265 tumors). Each point represents one tumor. Box plot elements are described in (a). Violin widths correspond to the density of points. P-values are from a two-tailed Wilcoxon rank sum test comparing mRNA expression levels between DDX3X wild-type (WT) and mutant tumors. (e) Allele frequencies of DDX3X mutations in TCGA tumors plotted against tumor purity (i.e. proportion of cancer cells) (n = 24 tumors). Each point represents one tumor. The diagonal lines represent the expected allelic frequencies for clonal mutations in males and heterozygous females. (f) Volcano plot showing differences in mRNA expression of 757 X-linked genes between females (n = 174 tumors) and males (n = 273 tumors) from the TCGA cohort. Each point represents one gene. The x-axis corresponds to the difference in mean expression relative to males and the y-axis shows FDR-adjusted p-values (using the Benjamini-Hochberg procedure). The horizontal red dotted line marks an FDR cut-off of 1%. The fold-changes and FDR values were estimated using DESeq2, parameterized to perform a two-tailed Wald test on negative binomial generalized linear model coefficients. (g) Number of RNA-seq reads supporting the A (x-axis) and C (y-axis) alleles of SNP rs5963957 at the DDX3X locus in the TCGA cohort (n = 468 tumors). Each point represents one tumor. Density plots show the distribution of points along the x- and y-axes separately for males and females. (h) Distribution of mean DNA methylation at the DDX3X promoter in female tumors (blue line; n = 180 tumors) compared to the promoters of other X-linked genes either upregulated (red line; n = 7,200 promoters across 180 tumors), or not upregulated (black line; n = 98,916 promoters across 180 tumors) in females compared to males. Blue and black distributions were compared using a one-tailed Kolmogorov-Smirnov test for a rightward shift in the black distribution relative to the blue distribution. TSS is an acronym for transcription start site.
