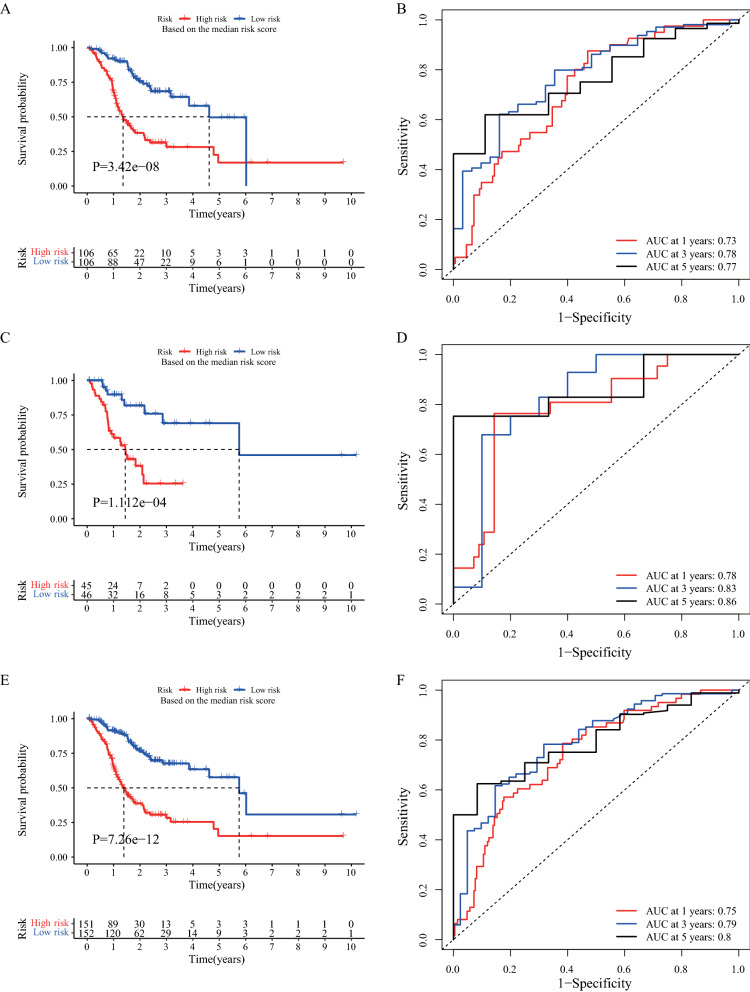
Fig. 3.
The prognostic evaluation and validation of the immune-related lncRNA pair (IRLP) signature in gastric cancer (GC). A The Kaplan–Meier (K-M) plot between the high- and low-risk groups in the training set (n = 212). B The time-dependent receiver operating characteristic (ROC) curves for 1-, 3-, and 5-years in the training set. C The K-M plot between the high- and low-risk groups in the validation set (n = 91). D The time-dependent ROC curves for 1-, 3-, and 5-years in the validation set. E The K-M plot between the high- and low-risk groups in The Cancer Genome Atlas (TCGA) set (n = 303). F The time-dependent ROC curves for 1-, 3-, and 5-years in TCGA set

