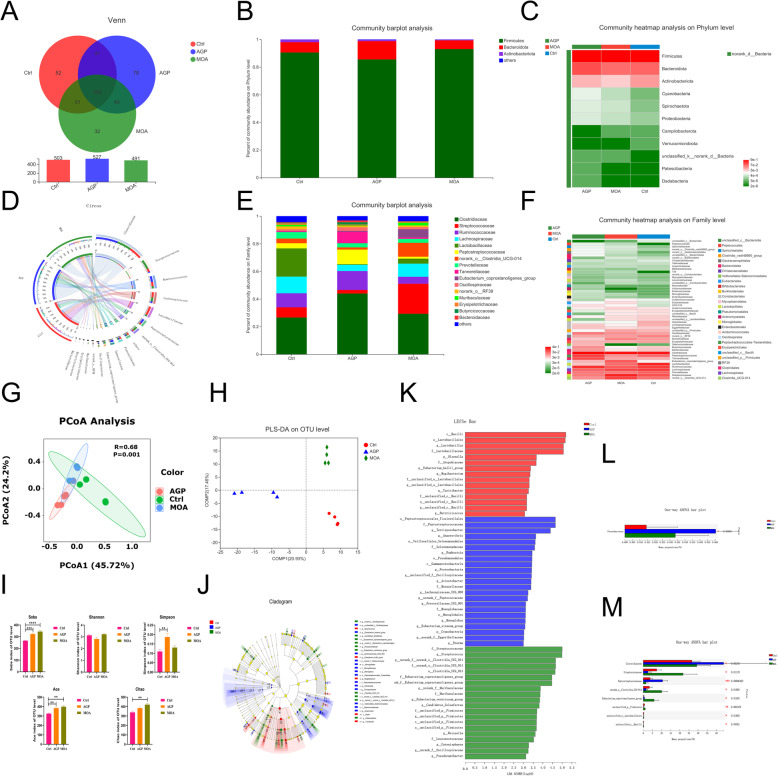
Fig. 6.
The microbial composition and structure of the colonic contents in piglets at 21 days of age as affected by dietary AGP and MOA supplementation. (A) Venn diagram. (B, E) Barplot analysis of microbial community compositions at phylum and family levels. (C, F) Heatmap analysis of microbial community compositions at phylum and family levels. (D) Circos diagram at family level. (G) Principal coordinate analysis (PCoA) based on bray-Curtis distance calculated from OTU abundance matrix (R = 0.68, P = 0.001). (H) Partial least squares discriminant analysis (PLS-DA) on OTU level, the analysis of similarities (ANOSIM) was used to exam the significant difference between treatments. (I) The α-diversity of microbial community, bar with the asterisk (*) level suggested the degree of significant difference and the values were indicated as means ± SEM (* 0.01 < P < 0.05, ** 0.001 < P < 0.01, *** 0.0001 < P < 0.001, **** P < 0.0001). (J) The discriminant analysis of LEfSe multi-level species difference from phylum to genus level. (K) Histogram of linear discriminant analysis (LDA) from phylum to genus level; the values were checked by a non-parametric factorial Kruskal-Wallis rank sum test to identify the microbes with the significant differential characteristics and a linear discriminant analysis was used to assess the degree of impact of abundance on the differences for each species. (L, M) Significance test of difference between treatments at phylum and family levels. Control (Ctrl): a corn soybean meal-based diet. AGP: Ctrl + 75 mg/kg chlortetracycline. MOA: Ctrl + 1500 mg/kg MOA. n = 4

