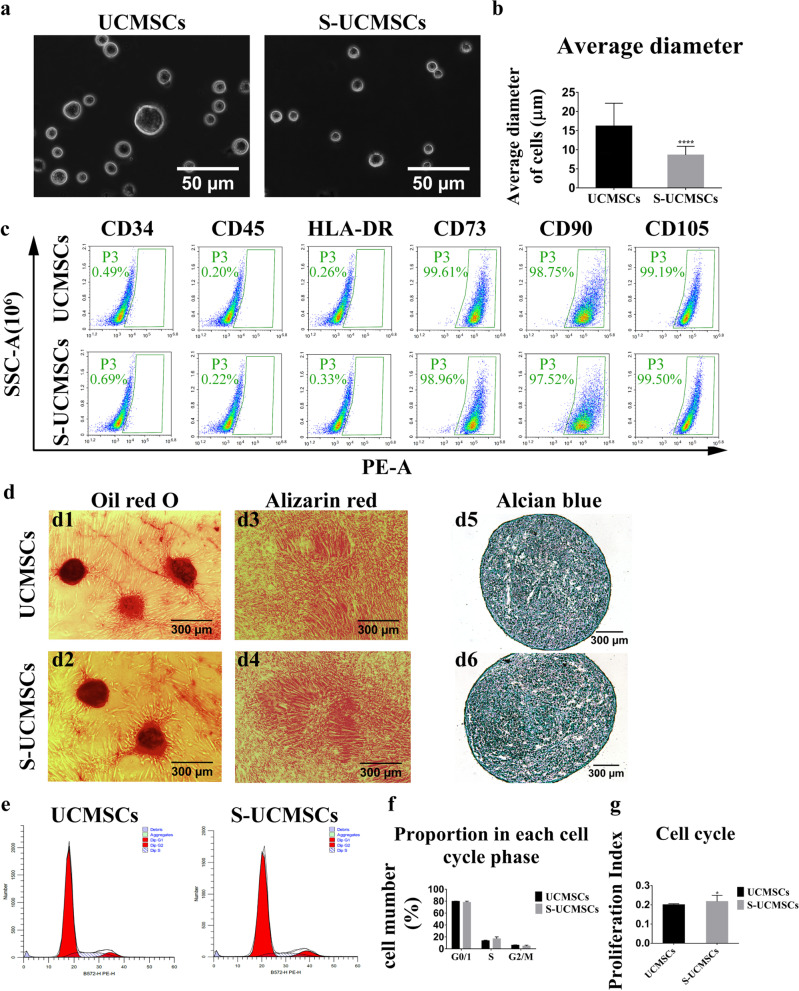
Fig. 1.
Comparison of the morphology and biological characterization of S-UCMSCs and UCMSCs. a In suspension culture, S-UCMSCs were significantly smaller than UCMSCs. b Statistical analysis of the average diameter of S-UCMSCs and UCMSCs (n = 100). c Flow cytometry showed that surface antigens of both S-UCMSCs and UCMSCs were positive for CD73, D90 and CD105 and negative for CD34, CD45 and HLA-DR. d Both S-UCMSCs and UCMSCs could be induced to differentiate into adipocytes, osteocytes and chondrocytes, which was confirmed by oil red O, Alizarin red and Alcian blue staining. e Representative cell cycle histograms from FACS. f The proportion of cells in each cell cycle phase (n = 3). g Statistical analysis showed that the PI of S-UCMSCs was higher than that of UCMSCs (n = 3). *P < 0.05, ****P < 0.001 versus UCMSCs. Scale bars: 20 μm (a), 100 μm (D1 and D2), 200 μm (D3 and D4), and 50 μm (D5 and D6)

