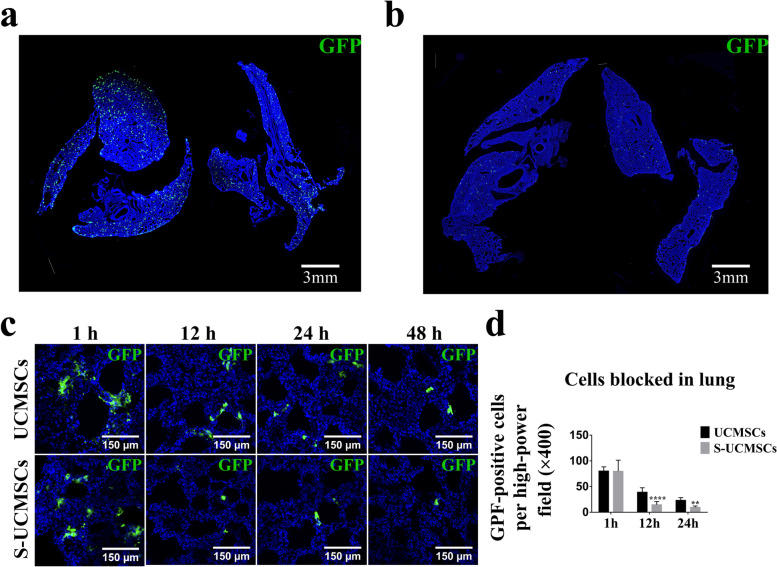
Fig. 3.
Comparison of the number of blocked cells in the lungs after transplantation. Representative micrographs of the whole lung fields of the S-UCMSC group at 1 h (a) and 24 h (b) showed that the number of blocked S-UCMSCs in the lung decreased rapidly after transplantation. c There were many GFP-positive cells in both the S-UCMSC and UCMSC groups at 1 h after transplantation, and there were significantly fewer S-UCMSCs blocked in the lungs than UCMSCs at 12 h and 24 h. d Statistical analysis of GFP-positive cells blocked in the lungs after transplantation (n = 3). **P < 0.01; ****P < 0.001 versus UCMSCs. Scale bar: 3 mm (a and b) and 100 μm (c)

