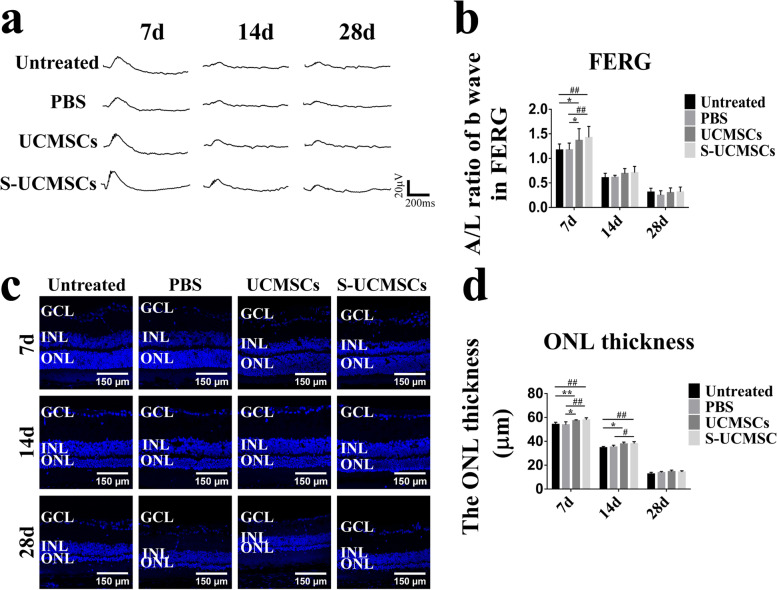
Fig. 4.
The effectiveness of S-UCMSCs and UCMSCs in RCS rats. a Representative waveforms of FERG b waves after transplantation. b Statistical analysis of the amplitude/latency (A/L) ratio of FERG b waves showed that the amplitude/latency of the S-UCMSC and UCMSC groups was significantly higher than that of the untreated and PBS groups (n = 8). c Representative micrographs of frozen sections of retinas stained with DAPI at 7 d, 14 d and 28 d after transplantation. d Statistical analysis of the ONL thickness (n = 4). *P < 0.05; **P < 0.01 versus UCMSCs; #P < 0.05; ##P < 0.01 versus S-UCMSCs; Scale bar: 100 μm

