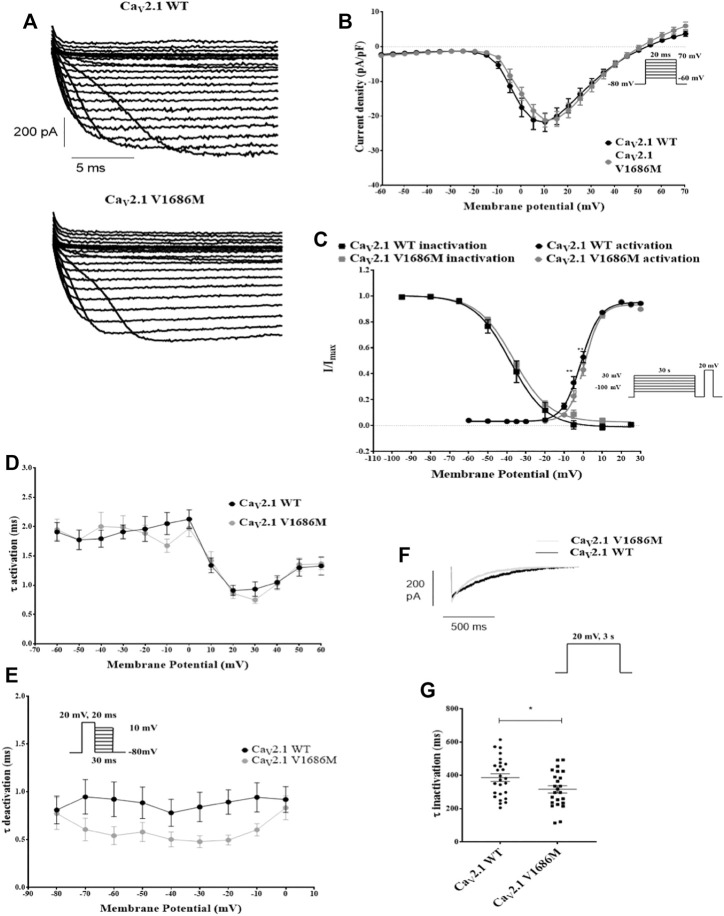
FIGURE 2.
Functional characterization of CaV2.1-V1686M. (A): Representative traces for currents elicited in transiently transfected HEK293 cells for CaV2.1-WT and CaV2.1-V1686M. (B): Current/voltage relationship of the peak current density for CaV2.1-WT (black, n = 32) and CaV2.1-V1686M (grey, n = 25). The voltage protocol is shown in the inset. (C): Steady-state activation and inactivation curves for CaV2.1-WT (black, activation n = 30, inactivation n = 20) and CaV2.1-V1686M (grey, activation n = 20, inactivation n = 18). The voltage protocol is shown in the inset. (D): Activation time constants for CaV2.1-WT (black) and CaV2.1-V1686M (grey). (E): Deactivation time constants for CaV2.1-WT (black) and CaV2.1-V1686M (grey). (F): Representative current trace for CaV2.1-WT (black) and CaV2.1-V1686M (grey) elicited by the voltage protocol shown in the inset, demonstrating slow inactivation. (G): Time constant for the slow inactivation CaV2.1-WT (black, n = 26) and CaV2.1-V1686M (grey, n = 24). For figure B–E the statistical analysis was performed with 2-way ANOVA, followed by a Sidak’s multiple comparison post-test; For figure G a unpaired student’s t-test was performed. p < 0.05 was considered statistically significant.

