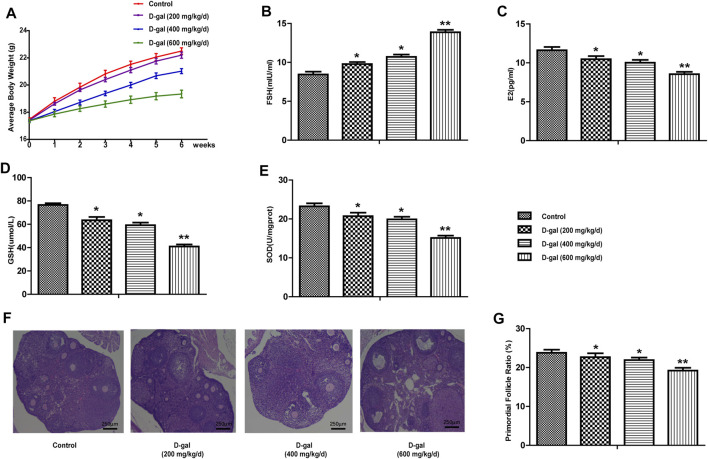
FIGURE 1.
Establish a mouse model of POF. (A) The body weight changes of mice in control and D-gal group (low, middle and high dose) were recorded during the process of inducing the POF model. (B,C) The serum FSH and E2 levels were tested in four groups. (D,E) The levels of GSH and SOD in the ovarian tissues were tested. (F,G) The proportion of primordial follicle. All data are shown as means ± SEMs, n = 5. Statistical significance: *p < 0.05, **p < 0.01.

