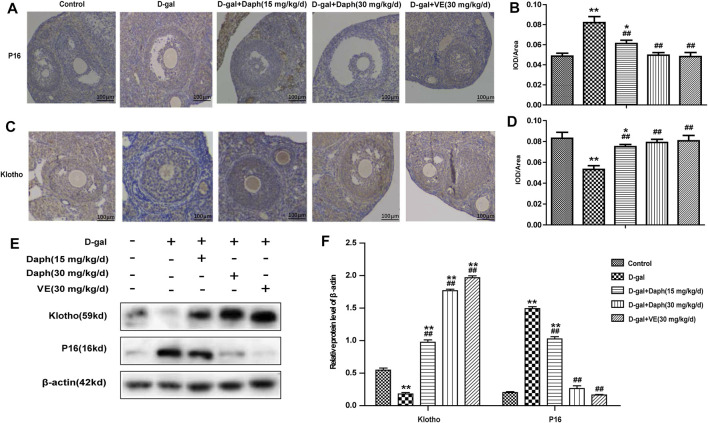
FIGURE 4.
Effects of Daph on p16 and klotho expression. (A,C) The IHC staining showed cellular locations of p16 and klotho proteins in different groups. (B,D) The p16 and klotho expressions were quantitatively analyzed. (E,F) Expressions of p16 and klotho were verified by western blot. The data in (A–D) are shown as means ± SEMs, n = 5. The data in (E–F) are shown as means ± SEMs, n = 3. Statistical significance: *p < 0.05, **p < 0.01, ## p < 0.01.

