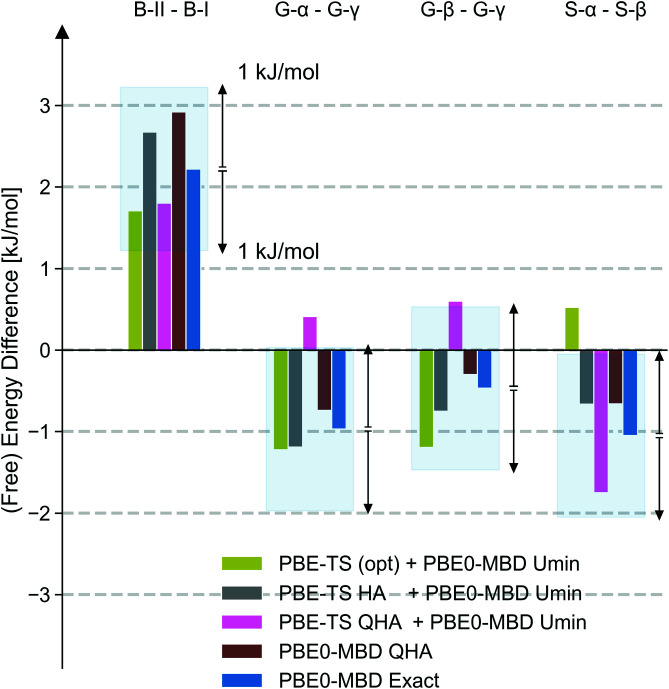
Fig. 4.
MLP (free) energy differences between forms II and I of benzene (B-II and B-I); α-, β-, and γ-glycine (G-α, G-β, and G-γ); and α- and β-succinic acid (S-α and S-β) at different tiers of accuracy: fixed-cell optimization using PBE-TS with a PBE0-MBD single-point energy (green), fixed-cell optimization and harmonic free energy using PBE-TS with a PBE0-MBD single-point energy (gray), quasi-harmonic approximation (QHA) free energy using PBE-TS with a single-point PBE0-MBD correction (pink), full PBE0-MBD–based QHA (brown), and the exact PI free energy difference (blue). The shaded region indicates free energy differences within 1 kJ/mol of the respective exact PI result as a guide to the eye.

