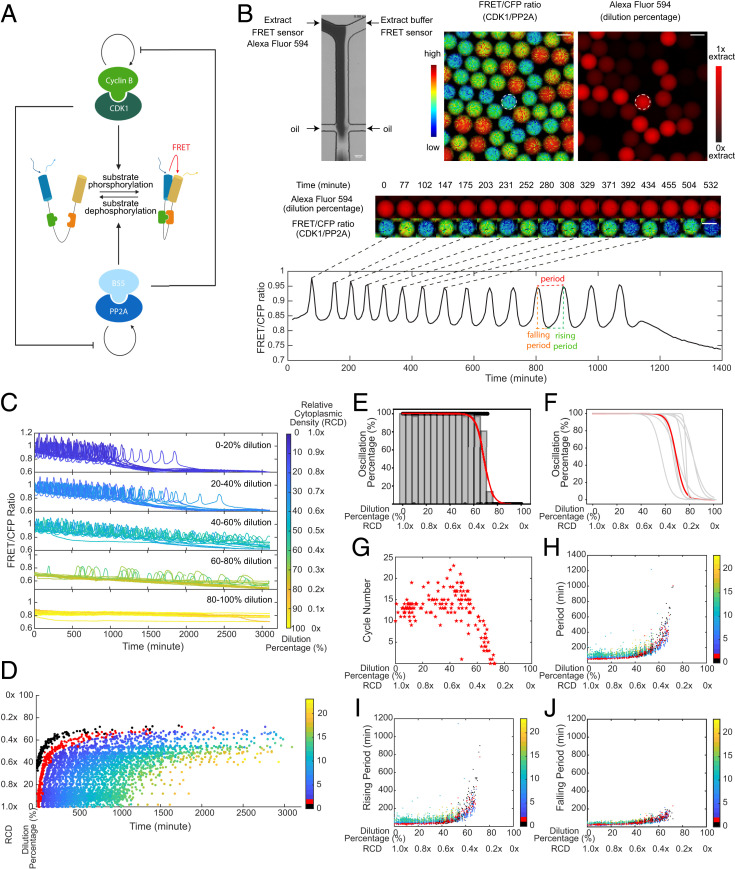
Fig. 1.
In vitro cell-cycle oscillators are robust to cytoplasmic dilutions. (A) Schematic diagram of the phosphorylation and dephosphorylation cycles of mitotic substrates driven by kinase, Cdk1–cyclin B, and its counteracting phosphatase, PP2A-B55δ, which mutually modulate each other’s auto-activation loops. The full diagram for the cell-cycle oscillator is in Fig. 3A. A Cdk1 FRET sensor is used to measure the ratio of Cdk1–cyclin B to PP2A:B55δ activity throughout oscillations. (B) FRET-based quantification of cell-cycle dynamics in microemulsion droplets containing 0 to 100% diluted Xenopus extracts. (Top Left) A microfluidic device generates droplets containing extracts and extract buffer mixed at different ratios. The extracts supplied with Alexa Fluor 594 Dextran dye flow through one inlet and the extract buffer through the other, both containing the same concentration of the Cdk1-FRET sensor. The diluted extracts are then encapsulated by surfactant oil into uniform-sized microemulsion droplets. (Top Right) Snapshots of FRET/CFP ratio and Alexa Fluor 594 Dextran channels for a field of droplets indicating the ratio of Cdk1/PP2A activity and the dilution percentage. (Middle) Time-lapse series of a selected droplet showing the first 550-min imaging in both channels. Selected time points correspond to either a peak or trough in FRET/CFP signals. The droplet has a constant red fluorescence intensity over time, indicating no leakage of the dye. (Scale bar, 100 μm.) (Bottom) Time course of FRET/CFP ratio of the selected droplet showing 15 undamped oscillations in 1,400 min. The oscillation period is quantified as the time interval between two consecutive peaks. The rising period (interphase duration) is defined as the time interval between a trough to the subsequent peak and the falling period (duration of mitosis) as the time interval between a peak to the subsequent trough. (C) Time courses of FRET/CFP ratio for droplets with 0 to 100% diluted extracts show the cell-cycle robustness to cytoplasmic dilutions. Each line represents a droplet, and the color of the line indicates the dilution percentage (RCD) of the droplet. The cytoplasmic density of undiluted droplets (dilution 0%) is defined as 1.0×. A total of 20 droplets are randomly selected from each dilution range and presented in the plot. In both C and D, t = 0 represents the start of imaging which was typically 1 h after extract preparation. (D) Raster plot showing peak times of FRET/CFP ratio as a function of dilution. The entry of the first cycle is significantly delayed as dilution percentage increases, and the overall oscillation time (from the start of the first peak to the last peak) is extended as well. Each dot represents a cycle peak in a droplet. The color bar indicates the order of peaks in time. The first peak observed in undiluted extracts is labeled in red and noted as cycle 1. Because of delays caused by dilution, a previous peak can be observed for some droplets with high levels of dilution which we note as cycle 0 (labeled in black). Cycle 0 is not observed in undiluted extracts because of the 1-h gap between extract preparation and the start of imaging. (E) Oscillation percentage of droplets over different dilution ranges. Oscillation percentage is calculated as the percentage of droplets that exhibit oscillations in all tracked droplets within each bin range. The bin width in the histogram is five. The red curve is the logistic regression fitting result for oscillation percentage data. This dataset includes 655 detected droplets in which 351 droplets yield oscillations. (F) Logistic regression fits for oscillation percentage versus dilution for nine replicates, showing the cell cycle robustness to dilutions is highly conserved across all different day experiments. The red highlighted curve corresponds to the experiment in E. (G) The cycle number versus dilution of individual droplets presents an initial plateau within low-moderate dilution ranges and subsequently decreases as a function of dilution. Cycle number for each droplet was quantified by a total number of peak-to-peak FRET/CFP oscillations. (H) Oscillation periods remain relatively constant up to 50% dilution and afterward increase dramatically with dilution until the dilution is close to 80%. Similar trends are observed in (I) rising periods and (J) falling periods. Each dot indicates one cycle in a droplet. The color bar represents the order of cycles.

