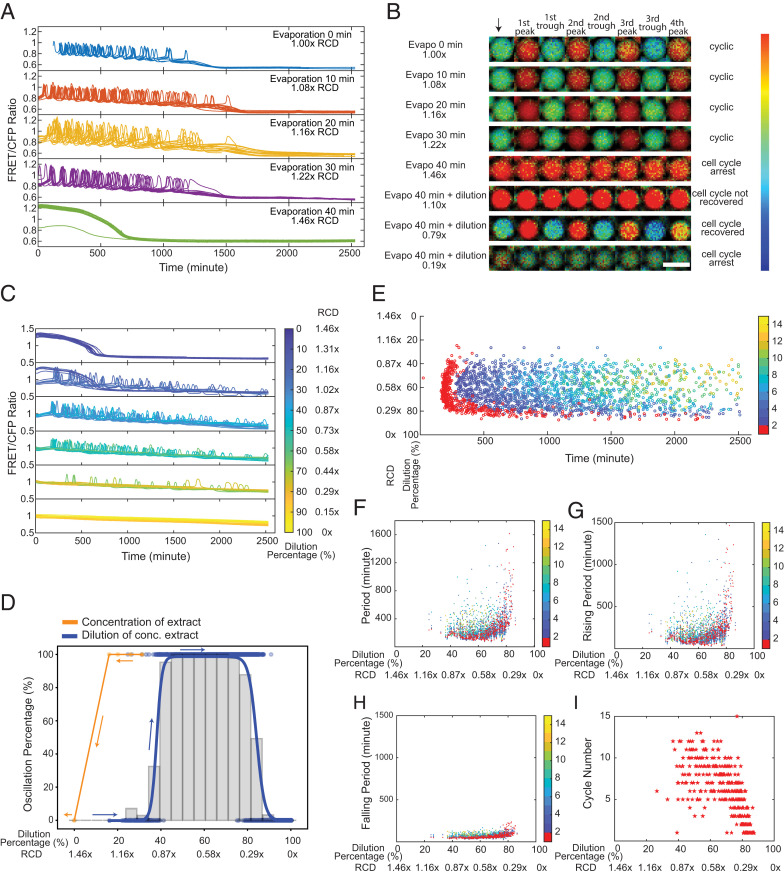
Fig. 2.
Cytoplasmic concentration leads to a reversible loss of oscillation but displays hysteresis. (A) Time courses of FRET/CFP ratio for individual droplets with concentrated extracts, showing cell cycles are robust to cytoplasmic concentrations. Extracts are concentrated via vacuum evaporation with the resultant relative cytoplasmic densities quantified by the intensity changes in Alexa Fluor 594 dextran dye before and after the concentration process. We define the cytoplasmic density of undiluted extracts as 1×, and the RCD for extracts with 10-, 20-, 30-, and 40-min evaporation are measured to be 1.08, 1.16, 1.22, and 1.46×, respectively. For ease of visualization, oscillation profiles of 20 droplets are randomly selected from each condition and presented in the plot. The sample size for different conditions (from Top to Bottom) is 46, 471, 140, 98, and 506, respectively. (B) FRET/CFP ratio images of representative droplets with varying cytoplasmic densities by initial concentration (from the first row to the fifth row) then dilution (from sixth row to eighth row), which demonstrates dilution of nonoscillatory concentrated extracts restores oscillations. The arrow indicates the start of imaging. Each following image is associated with either a trough or a peak of the selected droplets. (Scale bar, 100 μm.) The color bar indicates the FRET/CFP ratio as bright red corresponds to a high FRET/CFP ratio and dark blue corresponds to a low FRET/CFP ratio. The data for dilutions of concentrated extracts contains two replicates, resulting in a sample size of 1,198 detected droplets and in which 538 droplets have at least one cycle. (C) Time courses of FRET/CFP fluorescence intensity ratio in droplets containing 1.46× concentrated extracts with different dilutions, showing clear transitions from a high Cdk1 activity arrested state to oscillations to a low Cdk1 state. Each line is for one droplet, and the color of the line indicates the dilution percentage of the droplet. A total of 20 droplets are shown for each dilution range. Here, zero dilution has 1.46× RCD. (D) Cell cycle shows a hysteretic response to the change of cytoplasmic density. The change in oscillation percentage follows the orange curve when we concentrate the cytoplasmic density from 1.00 to 1.46×. When we start to dilute the concentrated extracts at 1.46× RCD, the oscillation percentage changes along the blue curve. These two distinct paths show a “history-dependent” nature. Histogram bars are measured oscillation percentage within each 5% dilution range as we dilute the 1.46× RCD extracts. (E) Raster plot for the dilution of concentrated extract experiment. The first peak onset has larger variations for droplets lying at the highly diluted threshold end (∼80%). The color bar indicates the order of cycle peaks, and the peak of the first cycle is highlighted in red. (F) Periods remain relatively constant at moderate dilutions after restoring oscillations (following the blue curve in D) with the RCD ∼0.80 to 0.44×. The variations are significant near two ends, especially the diluted end (0.29× RCD). Similar trends are observed in (G) rising periods and (H) falling periods. Each dot represents a cycle in a droplet. The color bar indicates the order of cycles, and the first cycle is highlighted in red. (I) Droplets with moderate dilutions have more cycles than those with either too low or too high dilution percentages at two ends.

