Fig. 3.
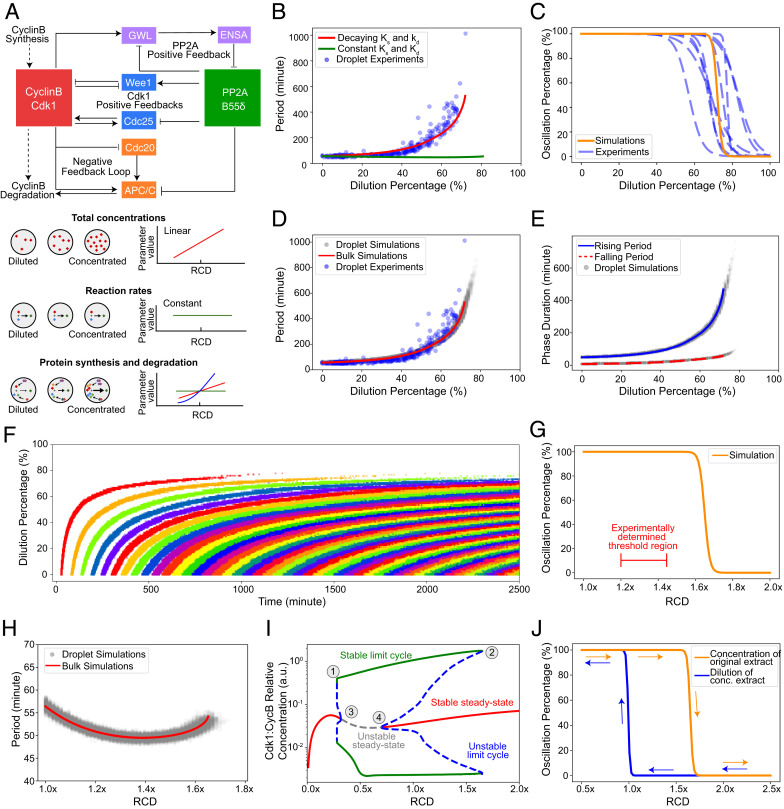
Dynamic model of the cell cycle reproduces the observed robustness of oscillations and the hysteretic response to cytoplasmic density. (A) Schematic view of the network controlling cell-cycle progression and dependency of parameters with cytoplasmic density. (Top) Each solid arrow corresponds to an influence present in the model. Pointed-headed arrows indicate activation and blunt-headed arrows inhibitions. Activation/inhibitions arise from phosphorylation/dephosphorylation reactions or binding/unbinding events. Dashed arrows represent synthesis and degradation processes. (Bottom) Different dependencies with cytoplasmic density are assumed for the parameters of the model. Total concentrations of proteins are considered to scale linearly with cytoplasmic density. In contrast, phosphorylation/dephosphorylation and binding/unbinding rates are considered to be constant because they are considered elementary reactions. Dependency of synthesis and degradation rate on cytoplasmic density are more complex, as many reactions underlie their effective reaction rate and are thus determined by comparing model predictions with experimental observations. (B) Period of oscillations as a function of dilution percentage. Comparison between models with decaying or constant synthesis/degradation rates. The decaying model has ks ∼ d3 and kd ∼d2 with d the RCD. Both models include a linear scaling of total concentrations with dilution. The model without decaying rates does not feature an increase in periods consistent with experimental observations. (C) A sigmoidal fit to the simulated oscillation percentage of droplets versus dilution is shown as a solid orange curve. Experimental curves (dashed blue line) are repeated from Fig. 1F for comparison. At a threshold of close to 80%, most droplets settle into a steady state consistent with experimental observations. (D) Simulated period as a function of dilution for droplet (gray dots) and bulk (red line) models. Bulk simulations are performed with a single set of ODE parameters representing the droplet's average parameters. Experimental data (blue dots) is presented for comparison. Both simulated and experimentally determined periods follow a similar trend with a slow increase at first and a sudden increase close to the threshold. (E) Duration of the rising and falling phases of the oscillation. Solid blue and dashed red lines represent bulk simulations for rising and falling periods, respectively. Dots represent droplet simulations. For both types of simulations, the rising period is more affected than the falling period. (F) Raster plot of the oscillation peaks over time for different dilution values. Each cycle is colored differently for visual clarity. Simulations show a similar trend for the start of oscillations observed in experiments. (G) Oscillation percentage from droplet simulations when the RCD is increased. The experimentally determined threshold is smaller than the one obtained through simulations. (H) Period as a function of RCD for concentration of extracts. Bulk and droplet simulations are shown. For the concentration of the extract, the period remains comparatively constant with respect to dilution. (I) Bifurcation diagram with RCD as a control parameter. Vertical axis shows the maximum and minimum of Active Cdk1:CyclinB1 concentration. Stable dynamical states are represented by solid lines and unstable ones by dashed lines. Each color represents a different dynamical behavior. The stable limit cycle solution disappears through a saddle-node bifurcation by meeting with an unstable limit cycle solution (1, 2). Two supercritical Hopf bifurcations (3, 4) are observed for both concentration and dilution of the extract. This bifurcation structure leads to a hysteretic behavior in the appearance/disappearance of oscillations. (J) Hysteresis in the onset of limit cycle oscillations. Two different initial conditions are used for the simulations of each curve: one that is closer to the limit cycle and another one closer to the steady state in the concentrated extract.

