Fig. 4.
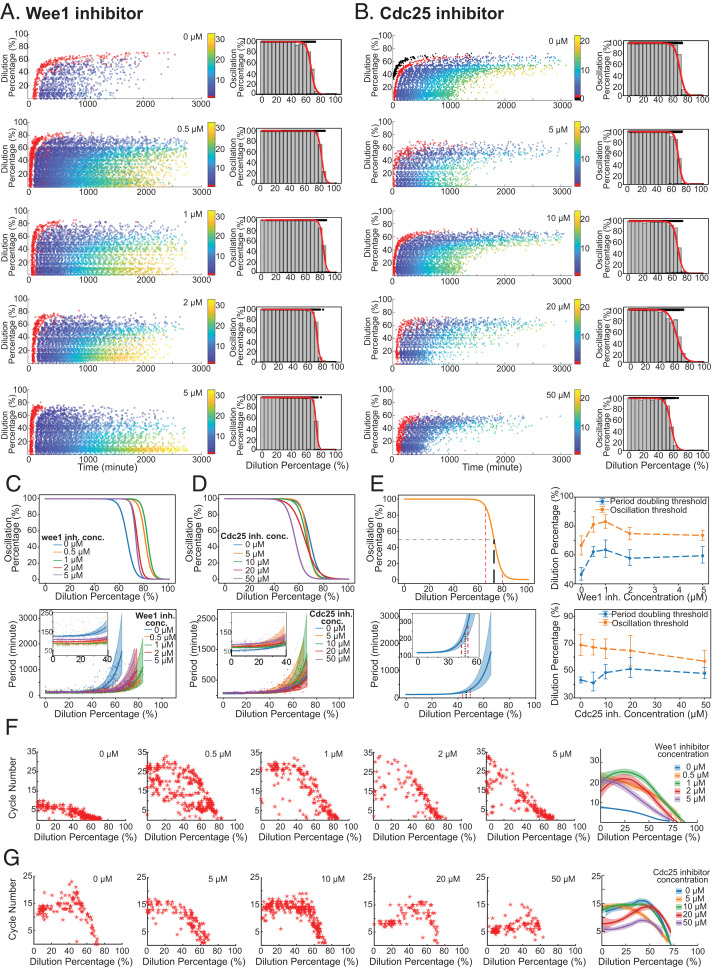
Cdk1 positive feedbacks are not essential for robustness to cytoplasmic dilution. (A and B) Extracts were supplemented with 0, 0.5, 1, 2, and 5 μM Wee1 activity’s inhibitor PD166285 (A) or with 0, 5, 10, 20, and 50 μM NSC95397 for inhibiting Cdc25 phosphatase activity (B) and then tested for their robustness to dilution. For each inhibitor concentration, the raster plot of the experimental result is shown as well as the oscillation percentage obtained. The system retains its function for most of the dilution range (0 to 60%) for all inhibitor concentrations with a slight difference in the absolute threshold values and the onset time and end time of oscillations. (C and D, Top) All oscillation percentage curves together to highlight the differences observed near the thresholds at different inhibitor concentrations of PD166285 (C) and NSC95397 (D). (Bottom) The obtained period profiles as a function of dilutions. (Insets) Zoomed-in views for the changes in period for low dilutions in which the curve is mostly flat. Period curves were fitted to exponential functions, and bootstrap was performed on the data to obtain CIs for the parameters. Shaded region represents one SD from the average parameters. (E) Quantification of robustness to dilution. (Left) Two different ways of measuring robustness based on oscillation percentage (Top) and period curves (Bottom). For oscillation percentage, we extract the dilution required for 90, 50, and 10% oscillation percentage and define the oscillation threshold as the dilution percentage at 50% oscillation percentage. For period curves, we calculate the dilution percentage at which period doubles to be defined as the period-doubling threshold. The estimated error on the parameters is used to infer a CI for the period-doubling dilution. (Right) The oscillation and period-doubling threshold change as a function of inhibitor concentration. Top corresponds to Wee1 inhibitor experiments and Bottom to Cdc25. (F and G) Total number of cycles as a function of dilution percentage for different concentrations of Wee1 inhibitor (F) and Cdc25 inhibitor (G). Rightmost plots show all the curves together smoothed by locally weighted scatterplot smoothing for ease of comparison. It can be appreciated that the inhibition of Wee1 increases the cycle number for low dilutions. The addition of the Cdc25 inhibitor tends to decrease the number of cycles in the system for most dilutions.

