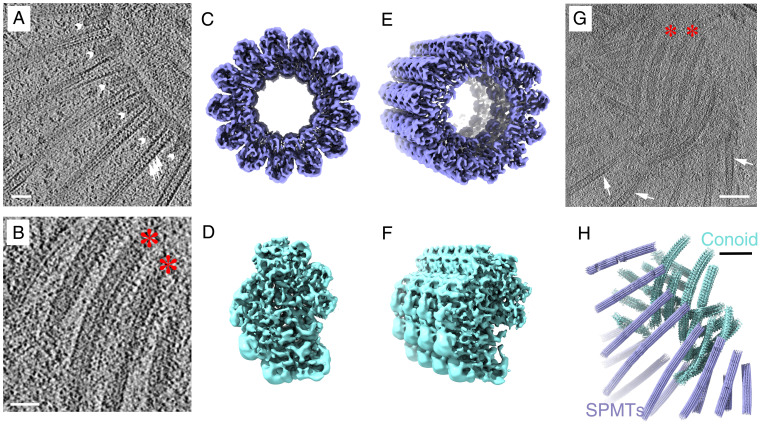
Fig. 2.
Determination of the 3D structures of apical SPMT (blue) and CF (cyan) segments from detergent-extracted Toxoplasma with tilt series recorded in a 300-kV electron microscope. (A) Portion of a tomographic slice showing the SPMTs with internal striation density (white arrows) and short interspersed pillars (white arrowheads; scale bar, 50 nm). (B) Portion of a tomographic slice showing individual CFs (red stars; scale bar, 50 nm). (C, E) Reconstruction of a representative SPMT segment viewed from top and a tilted angle. (D, F) The top view and tilted view of a reconstructed CF segment showing an asymmetric semicircular profile. (G) A representative tomographic slice at the apical end of a detergent-extracted cell, containing individual SPMTs (white arrows) and CFs (red stars; scale bar, 100 nm). (H) The 3D organization of SPMTs and CFs in the local region of the reconstructed tomogram shown in G based on the refined coordinates of individual particles.

