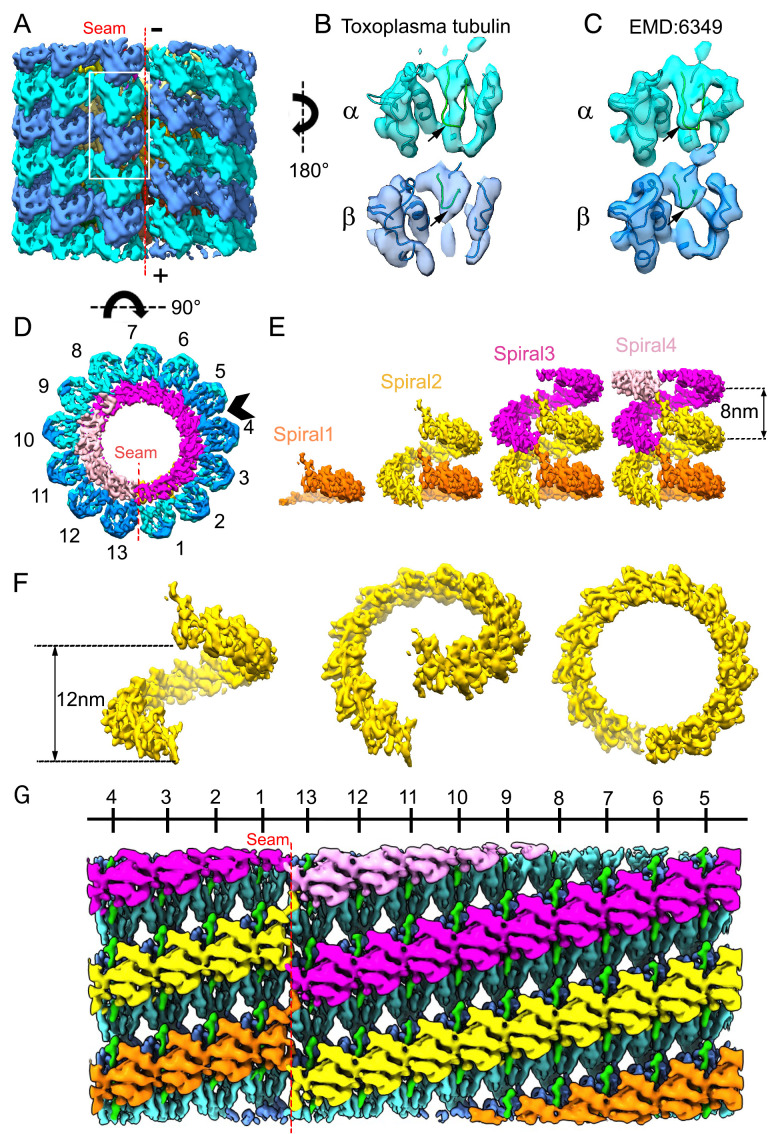
Fig. 3.
Subtomogram average of SPMT tubulins and their associated lumen complex from detergent-extracted parasites. (A) The arrangement of α- (cyan) and β- (blue) tubulin subunits in the averaged density map of the SPMT segment, viewed from the seam and showing the arrangement of the 13 protofilaments. The plus (+) and minus (−) ends of the microtubule are as indicated. The minus (up) end is toward the APR. (B) Density for an αβ-tubulin dimer as represented by the white boxed area of A, viewed from within the SPMT lumen. Note the S loop (green loop indicated by black arrows) in α-tubulin has extended density, but not in β-tubulin; this is validated by C, an αβ-tubulin dimer segmented from a porcine microtubule (EMD6349) showing the S loop density of differences displayed at 8 Å, also viewed from the lumen side. (D) Nontubulin densities inside the tubulin spiral, viewed within a cross-section of SPMT, are colored. (E) Stacked spiral architecture of the IS complex with four stacked spirals shown in pink, magenta, yellow, and orange. (F) One stack of the IS in yellow viewed from the seam at different angles. (G) Unwrapping the SPMT between protofilaments 4 and 5, indicated by an arrowhead in D, shows the SPMT assembly from the inside, with an IS density axially arrayed along the tubulin lattice with apparent repeating units.

