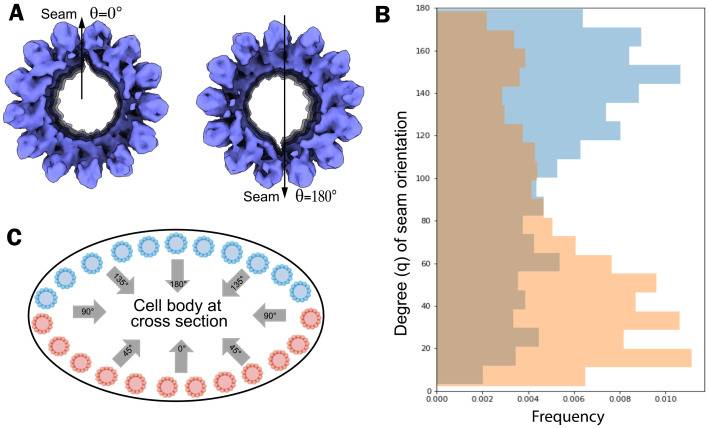
Fig. 4.
The seam orientation of SPMT in tomograms of intact cells is nonrandom. (A) In-cell SPMT segment density is oriented with the seam facing down (θ = 180°) or up (θ = 0°). We used the gap in the cryo-EM density map of the SPMT segment as a marker of the microtubule seam. (B) The seam of apical microtubules along their axis is analyzed by measuring its angle relative to the z axis in cell tomograms (n = 5). (C) A schematic representation of SPMT models in the cell body at cross-section, based on the observed cross-section of the cell body in the tomograms. The blue color is used for the microtubules in the “top” half layer of the cell (i.e., toward the electron beam), and the orange color is used for the microtubules in the “bottom” half of the cell. Note that the seam is predominantly oriented toward the center of the somewhat flattened cell body, with orientation angle 90° < θ < 180° for SPMTs in blue or 0° < θ < 90° for SPMTs in orange.

