Fig. 6.
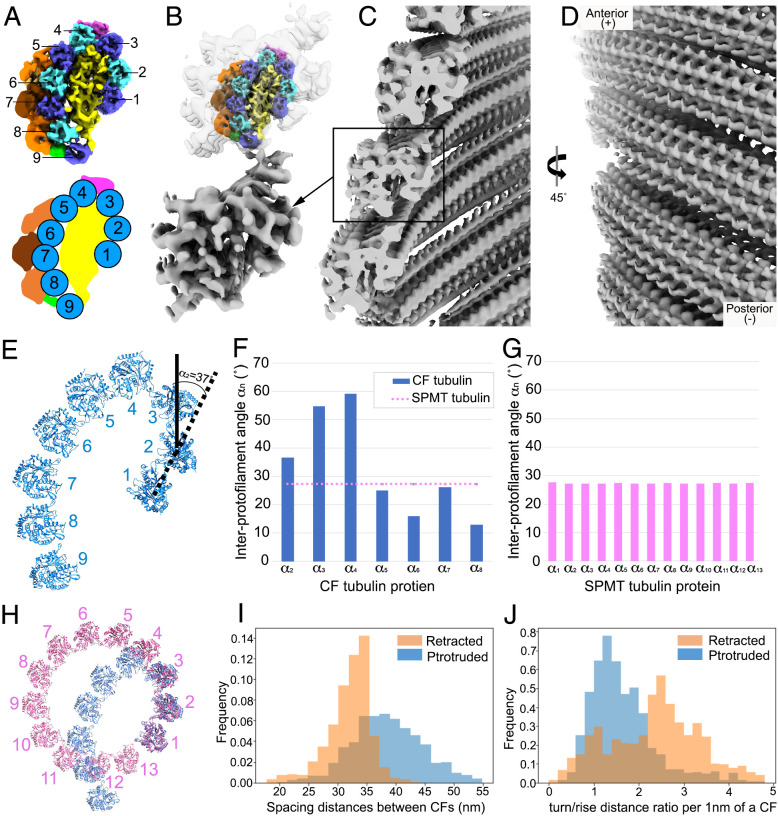
CFs are oriented in parallel with a plus-like end at the anterior. (A) Reconstruction of a CF segment from protruded conoids from detergent-extracted cells, generated by subtomogram averaging and shown in cross-section, viewed from the minus-like end. The cartoon (on the Bottom) illustrates the structural arrangement of the nine tubulin columns that form the comma-like architecture. (B) Low-resolution reconstruction of a CF segment from conoid-protruded intact cells, generated by subtomogram averaging. Above this is shown the higher-resolution structure of A inserted into the low-resolution structure from intact cells. (C) The CFs in a protruded conoid are assembled into spiral filaments with a “parallel” orientation and the opening of the comma shape facing the interior of the conoid. (D) The spiral CFs viewed from the conoid surface. (E) Zoomed-in model of tubulins within a CF segment. An example of how interprotofilament angles were determined is shown for the angle between a line connecting the centers of protofilaments 1 and 2 relative to such a line for protofilaments 2 and 3; this was defined as α2 and was determined to be 37°. (F) The interprotofilament angles were measured for each protofilament relative to the ones on either side. (G) As for F, except the interprotofilament angles were measured for the SPMT protofilaments. (H) Comparison of the protofilament arrangement in the SPMTs and CFs with the tubulin model fitted into the cryo-ET density map. Note the marked kink at protofilaments 3 and 4 in the CF. (I) Closest spacing distance between neighboring CFs showing the increased spacing in protruded CFs (blue) relative to retracted ones (orange). Data are from analysis of three protruded and four retracted conoids of intact cells. (J) The turn/rise distance ratio was measured every 1 nm along the CF axis, showing that the CFs in retracted (orange) conoids are higher than in protruded conoids (blue).

