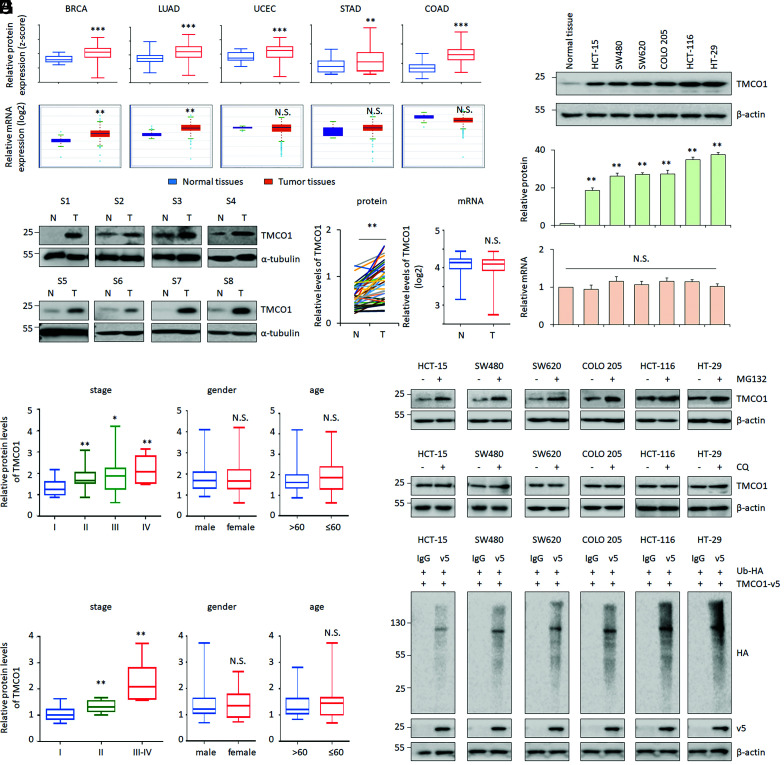
Fig. 1.
TMCO1 protein is overexpressed in human colon cancer tissues. (A and B) TMCO1 protein and mRNA levels were obtained in BRCA, LUAD, UCEC, STAD and COAD, and normal control tissues by analyzing CPTAC (A, Upper) and The Cancer Genome Atlas (A, Lower) databases, respectively. Representative WB and quantification of TMCO1 protein expression in 40 pairs of human colon cancer tissues (T) and their matched adjacent normal controls (N) are present in (B). α-tubulin was used as a loading control. (C and D) Correlations between TMCO1 proteins and patients’ characteristics (stages, sex, or age) were analyzed using CPTAC dataset (C) or WB data derived from B (D). (E) mRNA levels of TMCO1 were detected by qRT-PCR (E) in the same set of colon cancer samples described in B. (F) Representative WB of TMCO1 (Top), quantification of TMCO1 protein (Middle), and qRT-PCR of TMCO1 mRNA (Bottom) in human colon cancer cell lines were present. (G and H) Representative WB of TMCO1 in colon cancer cell lines after treatment with proteasome inhibitor MG132 (40 μM) (G) or lysosome inhibitor CQ (50 μM) (H) were determined by WB. β-actin was used as a loading control. (I) TMCO1 ubiquitination (Ub-TMCO1) was determined in colon cancer cell lines by IP of anti-v5 followed by WB with anti-HA after transfecting TMCO1-v5 and Ubiquitin (Ub)-HA. β-actin was used as a loading control. Data are derived from three independent experiments and represented as mean ± SEM in the bar graph shown in F and SI Appendix, Fig. S1 C and D. The quantification of TMCO1 was analyzed by image J. Values in the control or HT-29 cells were normalized to 1. *P < 0.05; **P < 0.01; ***P < 0.001; N.S., not significant (A–F).

