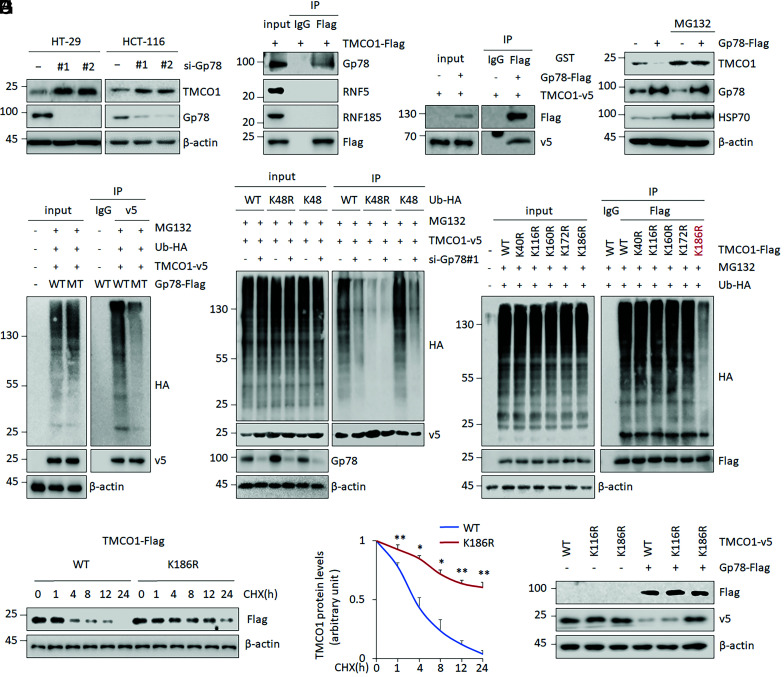
Fig. 2.
TMCO1 is a substrate of Gp78. (A) Representative WB images were determined by WB after Gp78 KD in HT-29 and HCT-116 cells. β-actin was used as a loading control. (B and C) The interactions between TMCO1 and candidate E3 ligases, Gp78, RNF5, and RNF185 were analyzed by IP assays in HT-29 cells (B). The direct binding between TMCO1 and GP78 was determined by an in vitro IP using purified proteins (C). (D) TMCO1 protein levels were detected by WB after Gp78 OE in the presence or absence of proteasome inhibitor MG132 (40 μM). HSP70 was used as an E3 ligase–regulated protein control and β-actin was used as a loading control. (E–G) Ub-TMCO1 was determined by IP/WB in HT-29 cells overexpressing WT Gp78-Flag or E3 ligase–defective mutant (MT), C337/374S Gp78-Flag (E), in cells overexpressing WT or mutant (K48, K48R) Ubiquitin (Ub)-HA in combination with Gp78 KD (F), or in cells overexpressing WT TMCO1 or TMCO1 with mutations at the predicted ubiquitination sites (G) in the presence of MG132 (20 μM). (H) Representative WB (Left) and quantification (Right) of Flag-tagged TMCO1 (WT and K186R) protein in the presence of 100 μg/mL CHX for the indicated time periods in HT-29 cells. β-actin was used as a loading control. Flag-tagged TMCO1 levels in the untreated cells were normalized to 1. (I) The Flag-tagged TMCO1 (WT, K116R, and K186R) levels were evaluated and quantified by WB and imageJ after ectopic Gp78 expression in HT-29 cells. β-actin was used as a loading control. Data are derived from three independent experiments and represented as mean ± SEM in the bar graph (A, D, E–G, and I). Quantification data are shown in SI Appendix, Fig. S2 A, E, and H). Values in the WT controls were normalized to 1. *P < 0.05; **P < 0.01 (H).

