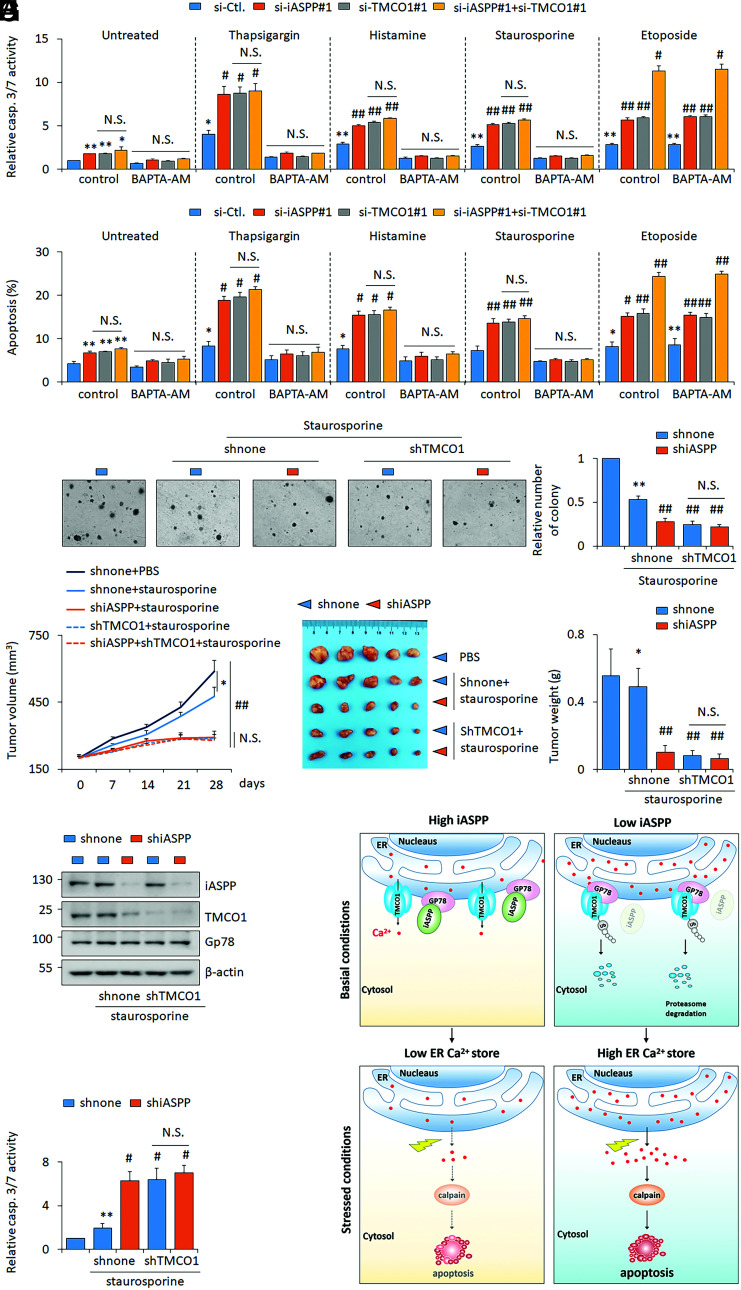
Fig. 8.
Inhibiting iASPP-TMCO1 axis increases staurosporine sensitivity both in vitro and in vivo. (A and B) The apoptosis levels were revealed by caspase 3/7 activity assay (A) and Annexin V/PI staining (B) after iASPP KD, TMCO1 KD, or double KD in the presence of thapsigargin (1 μM), histamine (100 μM), staurosporine (100 nM), or etoposide (10 μM), with or without a selective calcium chelator BAPTA-AM (50 μM) in HT-29 cells. (C) Clone formation of shnone, shiASPP, shTMCO1, and shiASPP+shTMCO1 HT-29 stable lines with or without staurosporine (100 nM) was determined by soft agar assays. Relative clone formation ability was quantified and shown in the bar graph. The clone formation of the dimethyl sulfoxide (DMSO)–treated shnone HT-29 cells was normalized to 1. (D–F) Tumor volumes at the indicated time (D), tumor images (E), and the tumor weight (F) of the indicated HT-29 xenografts with or without staurosporine treatments were presented. (G and H) The representative images of iASPP, Gp78, and TMCO1 protein (G) and caspase 3/7 activity (H) were determined in the indicated xenografts. β-actin was used as a loading control. (I) Proposed model of iASPP’s activity in regulating ER Ca2+ store by disrupting Gp78-mediated TMCO1 degradation. iASPP OE in cancer cells leads to an increased TMCO1 expression by competing with TMCO1 in binding with E3 ligase Gp78. The activation of the identified iASPP-Gp78/TMCO1 axis results in a decreased ER Ca2+ store, rendering cancer cells resistant to cytosolic Ca2+-induced cell death. Cells with low iASPP expression levels or inhibiting iASPP expression sensitivities cell’s response to cytosolic Ca2+-induced cell death. Bar graphs represent the mean ± SEM from three independent assays (A–C). The average values are present in the graphs (D, F, and H) (means ± SD) (n = 5 for each group). *P < 0.05; **P < 0.01; N.S. not significant; #P < 0.05, ##P < 0.01, compared with TG, histamine, staurosporine, or etoposide-treated controls (A–D, F, H).

