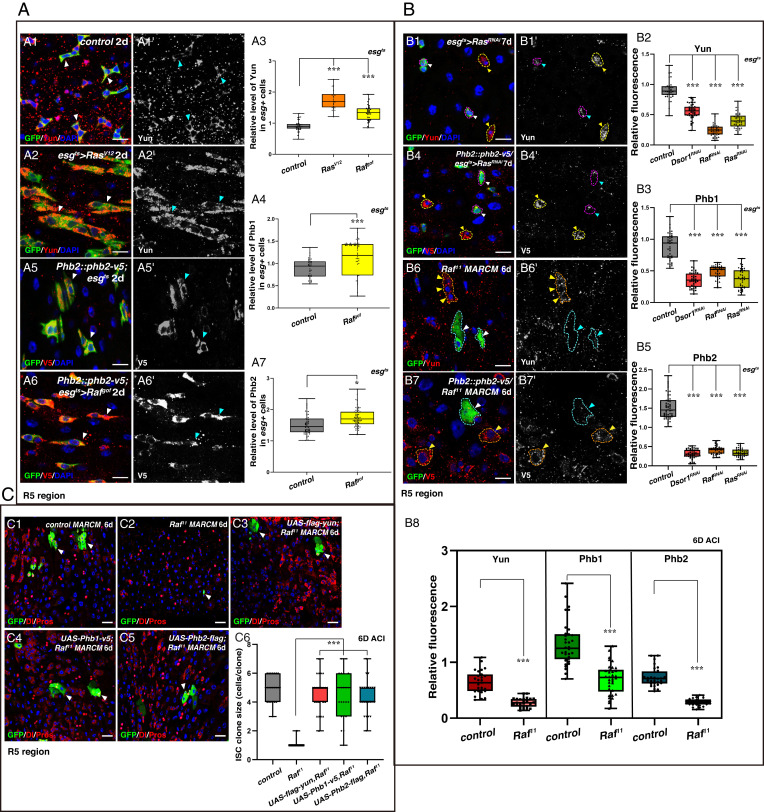
Fig. 5.
The Yun/PHB complex is regulated by EGFR signaling. (A) The Yun/PHB complex is positively regulated by EGFR signaling. (A3) Quantification for the IOD of Yun. Mean ± SD is shown. ***P < 0.001. (A4) Quantification of the IOD of Phb1. Mean ± SD is shown. ***P < 0.001. (A7) Quantification of the IOD of Phb2. Mean ± SD is shown. *P < 0.05. (B) The levels of the Yun/PHB complex are significantly diminished upon inhibition of EGFR signaling. (B2) Quantification of the IOD of Yun. Mean ± SD is shown. ***P < 0.001. (B3) Quantification of the IOD of Phb1. Mean ± SD is shown. ***P < 0.001. (B5) Quantification of the IOD of Phb2. Mean ± SD is shown. ***P < 0.001. (B8) Quantification of the IOD of Yun and Phbs. Mean ± SD is shown. ***P < 0.001. (C) The Yun/PHB complex acts downstream of EGFR signaling. (C6) Quantification of the clone size indicated (C1 to C5). Mean ± SD is shown. ***P < 0.001 [Scale bars, 10 μm (A and B) and 20 μm (C)].

