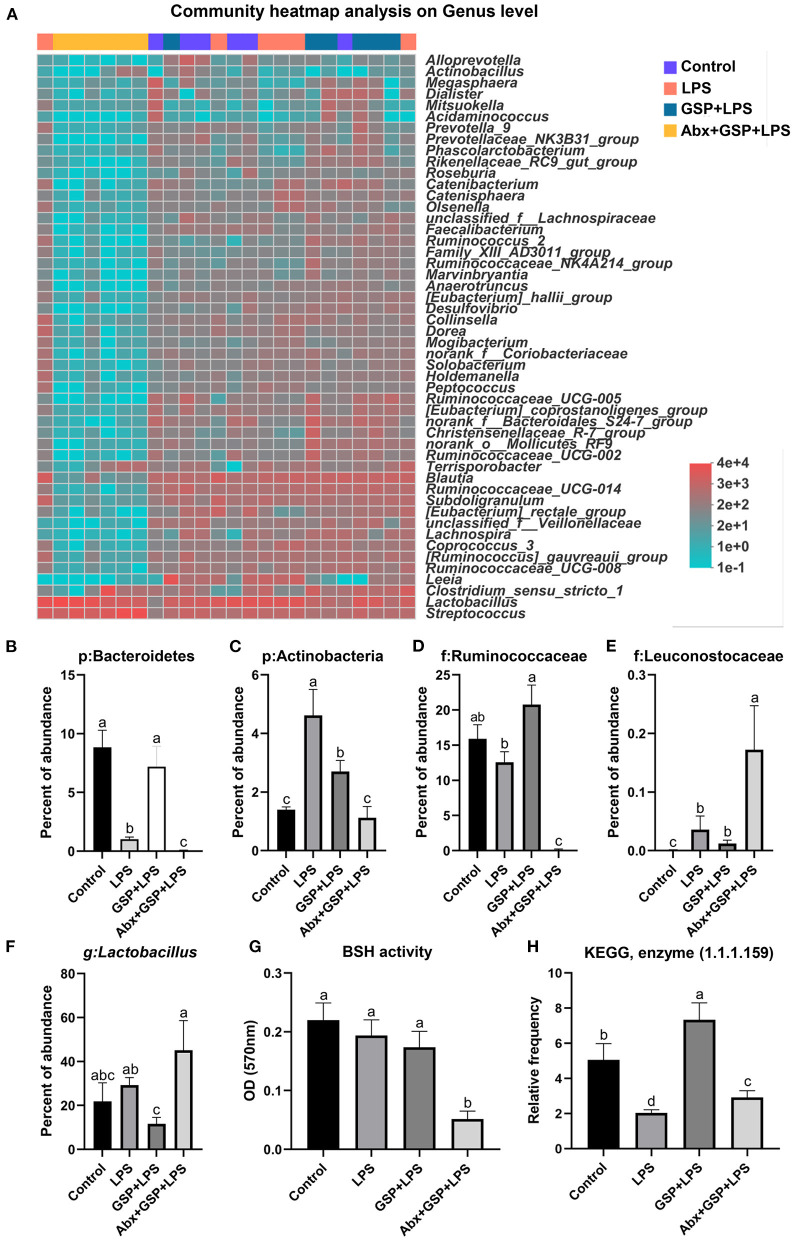
Figure 3.
The BSH activity and the abundance of BSH microbes in C57BL/6 mice with different treatments in Experiment 1. (A) The relative abundance of caecum bacteria at the genus level. (B–F) The relative abundance of Bacteroidetes, Actinobacteria, Ruminococcaceae, Leuconostocaceae, and Lactobacillus. (G) Fecal bile salt hydrolases (BSH) activity. (H) The KO abundance of microbial HSD enzyme (1.1.1.159) in KEGG analysis. Control, control group that oral gavaged with physiological saline before i.p. PBS injection; LPS, a LPS injection group that oral gavaged with physiological saline before i.p. LPS injection; GSP + LPS, a GSP administration group that oral gavaged with 250 mg/kg GSP before i.p. LPS injection; Abx + GSP + LPS, an antibiotic group that given a mixture of antibiotics in drinking water before the Experiment 1, and then coupled with GSP before i.p. LPS injection; BSH, bile salt hydrolases; HSD, hydroxysteroid dehydrogenase. Data are presented by the mean ± SEMs (n = 6). Bars with no letter in common are significantly different, p ≤ 0.05.

