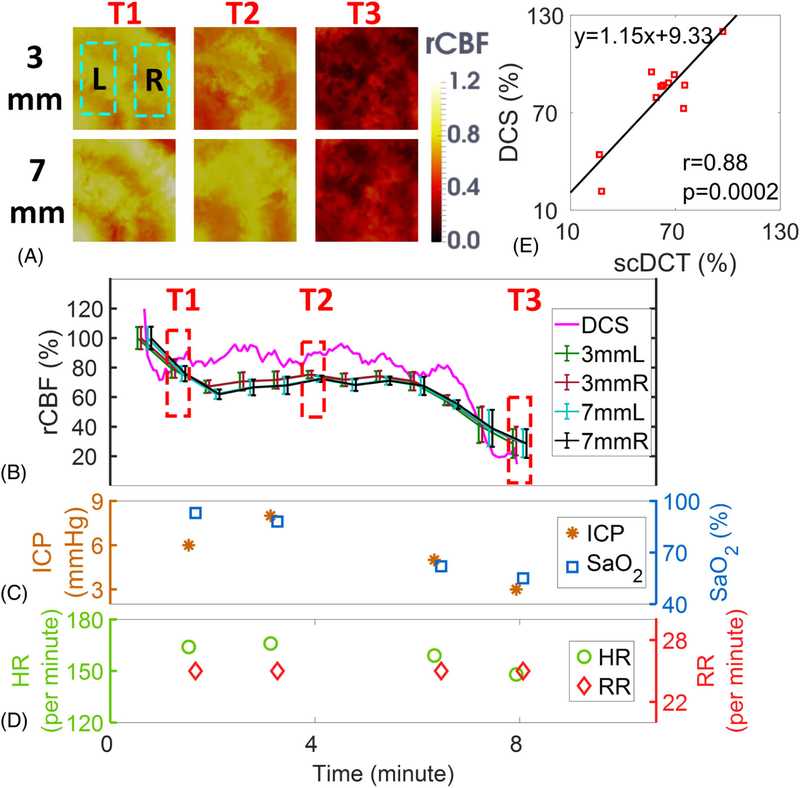
FIGURE 4.
Measurement Results from Piglet #1 during Asphyxia. A, Cross sectional views of 3D images of CBF at depths of 3 mm (scalp/skull) and 7 mm (cortex). Two regions of 20 × 10 mm2 were used to average CBF values in left and right hemispheres and marked with two dashed rectangles, respectively. T1: Baseline before asphyxia; T2: During asphyxia; T3: End of measurement. B, Time-course of rCBF changes measured by the scDCT and DCS. The dashed boxes represent the time points (T1 to T3) to take these images in Figure 4A. Error bars represent standard deviations of spatial rCBF values in the selected region. C, and D, Time-course of changes in ICP, SaO2, HR and RR. E, The linear regression between the scDCT and DCS measurements of rCBF in the cortex. CBF, cerebral blood flow; DCS, diffuse correlation spectroscopy

