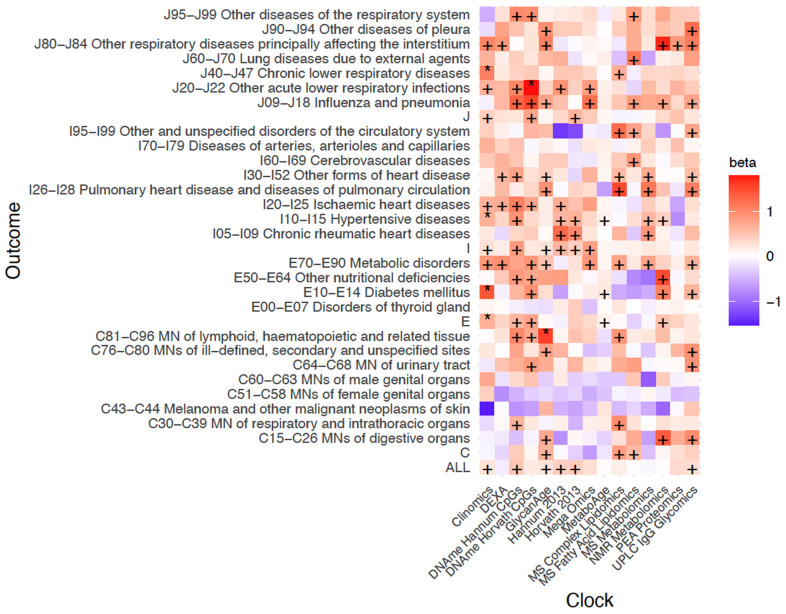
Figure 5.
Positive age acceleration associations observed with increased disease risk. Associations with rates of hospitalisation. +/* Association nominally/FDR<10% significant in the frequentist test that OCAA has a positive effect on outcomes. Beta: the relative effect of a year of OCAA to a year of chronAge on disease (initially measured in loge hazard ratios, effect sizes are unitless after division). A value of one indicates that a year of OCAA is equally as deleterious as a year of chronAge and is indicated in salmon colour. To facilitate reading, note the DNAme Horvath CpGs-BMI beta is 1.02 and the DNAme Hannum CpGs-C81-C96I beta is 1.00. Clock: the omics clock on which OCAA was measured. Disease group: the set of diseases (defined by ICD10 codes) which were tested for first incidence after assessment against the clock, already prevalent cases were excluded (Case numbers for each disease block in Supplementary Table 5).

