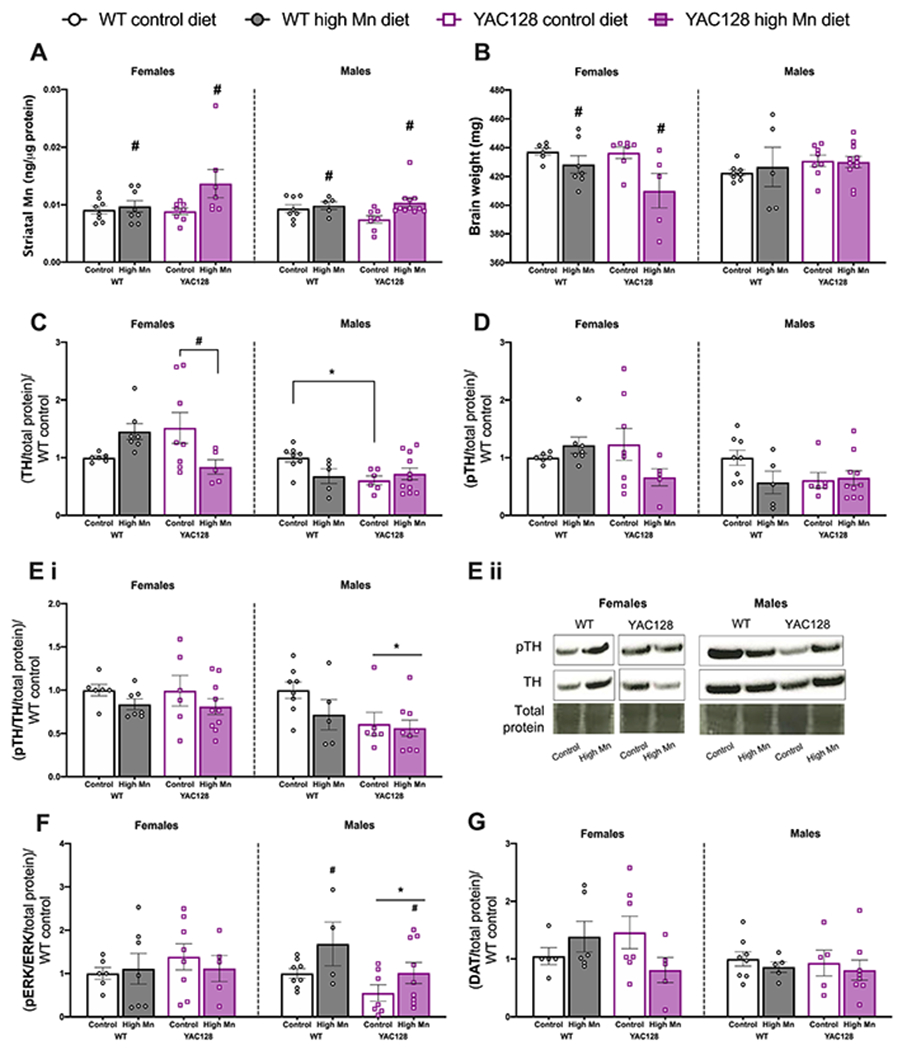
Figure 3.

Diet induced brain changes in young mice. (A) Striatal Mn concentration was significantly increased in females and males on high Mn diet with no differences between genotypes. (B) Brain weight was significantly lower in females on high Mn diet compared to control diet with no effect of genotype. No differences in brain weight were observed in males. (C) Tyrosine hydroxylase (TH) was decreased in YAC128 females on high Mn diet compared to YAC128 control diet. TH expression was significantly lower in YAC128 control diet males compared to WT. (D) Phosphorylated TH (pTH Ser 31) expression followed a similar pattern as total TH but differences were not statistically significance. (E) (i) No effect of genotype nor diet on pTH/TH ratio in females. YAC128 males had overall decreased pTH/TH ratio compared to WT regardless of diet. (ii) Representative blot images for changes pTH and TH in females (left) and males (right). For all western blots in young mice, sexes were run on separate blots and therefore should not be directly compared to each other. (F) No effect of genotype nor diet in females on pERK/ERK expression, but in males, overall high Mn diet increased pERK/ERK ratio and YAC128 mice had decreased pERK/ERK. (G) DAT expression was not significantly different among groups. For all, mean ± S.E.M. plotted unless otherwise noted. n= 5-8 per genotype-diet group for females and n=5-11 per group for males. *P<0.05 main effect of genotype, #P<0.05 main effect of Mn except where specific pairs are indicated with a horizontal bracket denoting Sidak’s post-hoc comparisons following a significant interaction.
